

512
J. Apostolakis
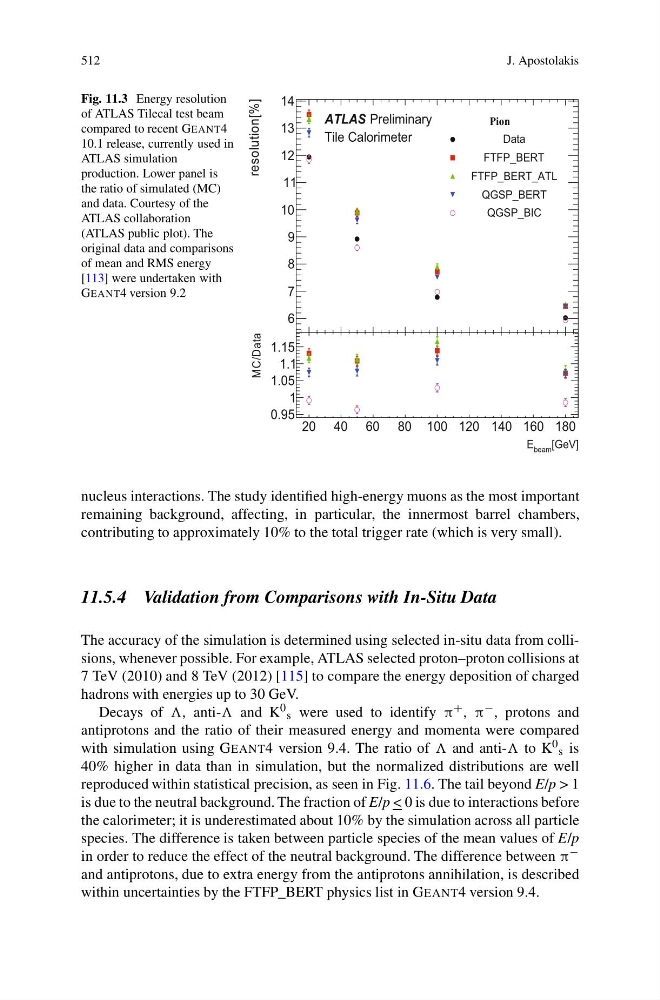
Fig. 11.3 Energy resolution
of ATLAS Tilecal test beam
compared to recent GEANT4
10.1 release, currently used in
ATLAS simulation
production. Lower panel is
the ratio of simulated (MC)
and data. Courtesy of the
ATLAS collaboration
(ATLAS public plot). The
original data and comparisons
of mean and RMS energy
[113] were undertaken with
GEANT4 version 9.2
resolution[%]
6
7
8
9
10
11
12
13
14
Pion
Data
FTFP_BERT
FTFP_BERT_ATL
QGSP_BERT
QGSP_BIC
[GeV]
beam
E
20 40 60 80 100 120 140 160 180
MC/Data
0.95
1
1.05
1.1
1.15
ATLAS Preliminary
Tile Calorimeter
nucleus interactions. The study identified high-energy muons as the most important
remaining background, affecting, in particular, the innermost barrel chambers,
contributing to approximately 10% to the total trigger rate (which is very small).
11.5.4 Validation from Comparisons with In-Situ Data
The accuracy of the simulation is determined using selected in-situ data from collisions, whenever possible. For example, ATLAS selected proton–proton collisions at
7 TeV (2010) and 8 TeV (2012) [115] to compare the energy deposition of charged
hadrons with energies up to 30 GeV.
Decays of , anti- and K 0 s were used to identify π + , π − , protons and
antiprotons and the ratio of their measured energy and momenta were compared
with simulation using GEANT4 version 9.4. The ratio of and anti- to K 0 s is
40% higher in data than in simulation, but the normalized distributions are well
reproduced within statistical precision, as seen in Fig. 11.6. The tail beyond E/p > 1
is due to the neutral background. The fraction of E/p < 0 is due to interactions before
the calorimeter; it is underestimated about 10% by the simulation across all particle
species. The difference is taken between particle species of the mean values of E/p
in order to reduce the effect of the neutral background. The difference between π −
and antiprotons, due to extra energy from the antiprotons annihilation, is described
within uncertainties by the FTFP_BERT physics list in GEANT4 version 9.4.
J. Apostolakis
Fig. 11.3 Energy resolution
of ATLAS Tilecal test beam
compared to recent GEANT4
10.1 release, currently used in
ATLAS simulation
production. Lower panel is
the ratio of simulated (MC)
and data. Courtesy of the
ATLAS collaboration
(ATLAS public plot). The
original data and comparisons
of mean and RMS energy
[113] were undertaken with
GEANT4 version 9.2
resolution[%]
6
7
8
9
10
11
12
13
14
Pion
Data
FTFP_BERT
FTFP_BERT_ATL
QGSP_BERT
QGSP_BIC
[GeV]
beam
E
20 40 60 80 100 120 140 160 180
MC/Data
0.95
1
1.05
1.1
1.15
ATLAS Preliminary
Tile Calorimeter
nucleus interactions. The study identified high-energy muons as the most important
remaining background, affecting, in particular, the innermost barrel chambers,
contributing to approximately 10% to the total trigger rate (which is very small).
11.5.4 Validation from Comparisons with In-Situ Data
The accuracy of the simulation is determined using selected in-situ data from collisions, whenever possible. For example, ATLAS selected proton–proton collisions at
7 TeV (2010) and 8 TeV (2012) [115] to compare the energy deposition of charged
hadrons with energies up to 30 GeV.
Decays of , anti- and K 0 s were used to identify π + , π − , protons and
antiprotons and the ratio of their measured energy and momenta were compared
with simulation using GEANT4 version 9.4. The ratio of and anti- to K 0 s is
40% higher in data than in simulation, but the normalized distributions are well
reproduced within statistical precision, as seen in Fig. 11.6. The tail beyond E/p > 1
is due to the neutral background. The fraction of E/p < 0 is due to interactions before
the calorimeter; it is underestimated about 10% by the simulation across all particle
species. The difference is taken between particle species of the mean values of E/p
in order to reduce the effect of the neutral background. The difference between π −
and antiprotons, due to extra energy from the antiprotons annihilation, is described
within uncertainties by the FTFP_BERT physics list in GEANT4 version 9.4.