

11 Detector Simulation
511
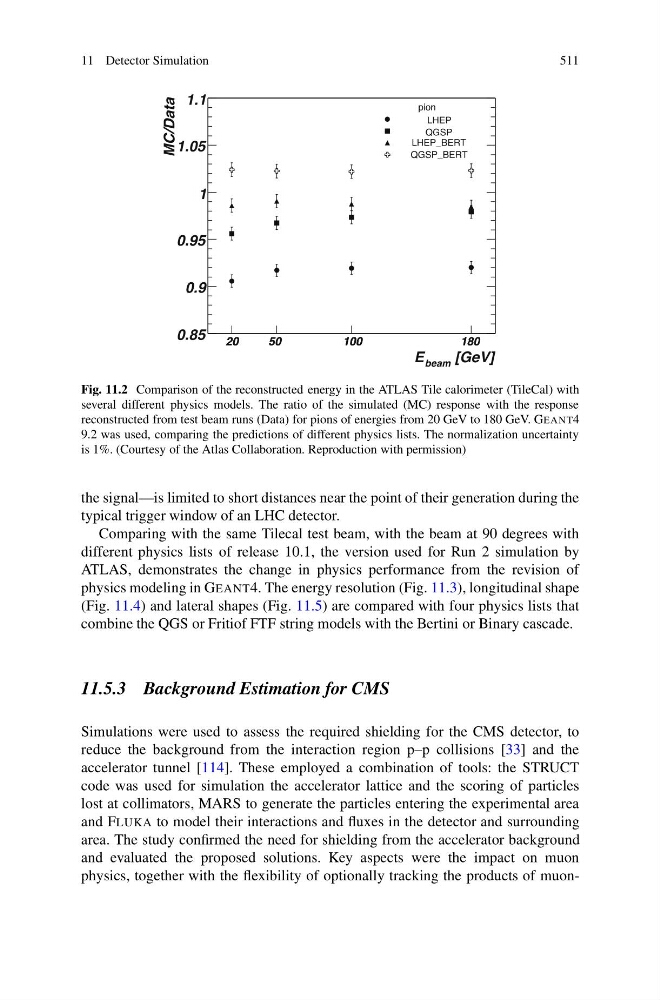
Fig. 11.2 Comparison of the reconstructed energy in the ATLAS Tile calorimeter (TileCal) with
several different physics models. The ratio of the simulated (MC) response with the response
reconstructed from test beam runs (Data) for pions of energies from 20 GeV to 180 GeV. GEANT4
9.2 was used, comparing the predictions of different physics lists. The normalization uncertainty
is 1%. (Courtesy of the Atlas Collaboration. Reproduction with permission)
the signal—is limited to short distances near the point of their generation during the
typical trigger window of an LHC detector.
Comparing with the same Tilecal test beam, with the beam at 90 degrees with
different physics lists of release 10.1, the version used for Run 2 simulation by
ATLAS, demonstrates the change in physics performance from the revision of
physics modeling in GEANT4. The energy resolution (Fig. 11.3), longitudinal shape
(Fig. 11.4) and lateral shapes (Fig. 11.5) are compared with four physics lists that
combine the QGS or Fritiof FTF string models with the Bertini or Binary cascade.
11.5.3 Background Estimation for CMS
Simulations were used to assess the required shielding for the CMS detector, to
reduce the background from the interaction region p–p collisions [33] and the
accelerator tunnel [114]. These employed a combination of tools: the STRUCT
code was used for simulation the accelerator lattice and the scoring of particles
lost at collimators, MARS to generate the particles entering the experimental area
and FLUKA to model their interactions and fluxes in the detector and surrounding
area. The study confirmed the need for shielding from the accelerator background
and evaluated the proposed solutions. Key aspects were the impact on muon
physics, together with the flexibility of optionally tracking the products of muon-
511
Fig. 11.2 Comparison of the reconstructed energy in the ATLAS Tile calorimeter (TileCal) with
several different physics models. The ratio of the simulated (MC) response with the response
reconstructed from test beam runs (Data) for pions of energies from 20 GeV to 180 GeV. GEANT4
9.2 was used, comparing the predictions of different physics lists. The normalization uncertainty
is 1%. (Courtesy of the Atlas Collaboration. Reproduction with permission)
the signal—is limited to short distances near the point of their generation during the
typical trigger window of an LHC detector.
Comparing with the same Tilecal test beam, with the beam at 90 degrees with
different physics lists of release 10.1, the version used for Run 2 simulation by
ATLAS, demonstrates the change in physics performance from the revision of
physics modeling in GEANT4. The energy resolution (Fig. 11.3), longitudinal shape
(Fig. 11.4) and lateral shapes (Fig. 11.5) are compared with four physics lists that
combine the QGS or Fritiof FTF string models with the Bertini or Binary cascade.
11.5.3 Background Estimation for CMS
Simulations were used to assess the required shielding for the CMS detector, to
reduce the background from the interaction region p–p collisions [33] and the
accelerator tunnel [114]. These employed a combination of tools: the STRUCT
code was used for simulation the accelerator lattice and the scoring of particles
lost at collimators, MARS to generate the particles entering the experimental area
and FLUKA to model their interactions and fluxes in the detector and surrounding
area. The study confirmed the need for shielding from the accelerator background
and evaluated the proposed solutions. Key aspects were the impact on muon
physics, together with the flexibility of optionally tracking the products of muon-