

516
J. Apostolakis
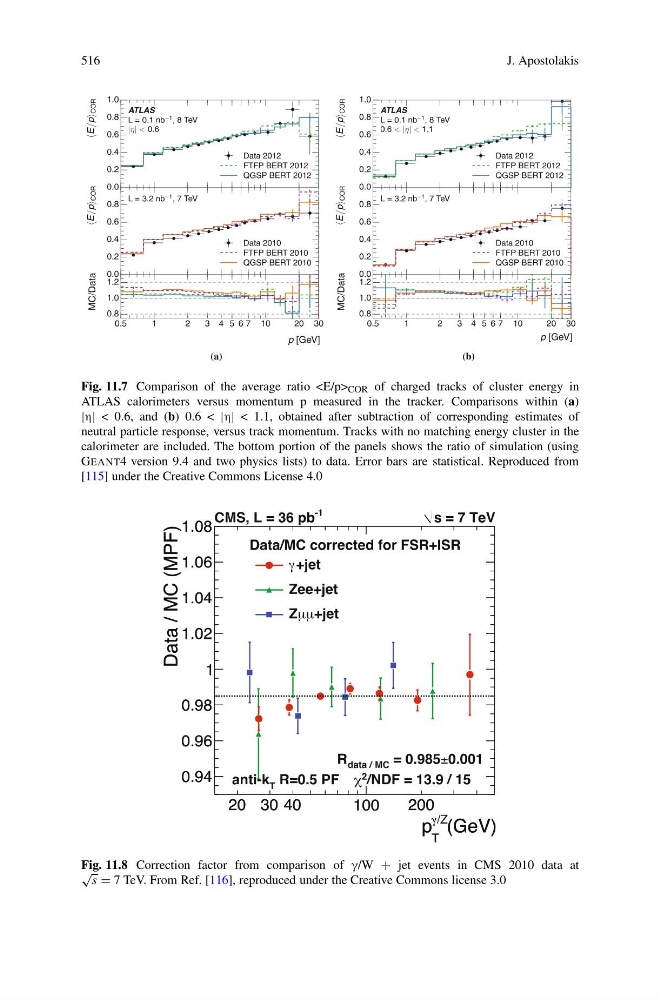
Fig. 11.7 Comparison of the average ratio COR of charged tracks of cluster energy in
ATLAS calorimeters versus momentum p measured in the tracker. Comparisons within (a)
|η| < 0.6, and (b) 0.6 < |η| < 1.1, obtained after subtraction of corresponding estimates of
neutral particle response, versus track momentum. Tracks with no matching energy cluster in the
calorimeter are included. The bottom portion of the panels shows the ratio of simulation (using
GEANT4 version 9.4 and two physics lists) to data. Error bars are statistical. Reproduced from
[115] under the Creative Commons License 4.0
Fig. 11.8 Correction factor from comparison of γ/W + jet events in CMS 2010 data at
√
s = 7 TeV. From Ref. [116], reproduced under the Creative Commons license 3.0
J. Apostolakis
Fig. 11.7 Comparison of the average ratio
ATLAS calorimeters versus momentum p measured in the tracker. Comparisons within (a)
|η| < 0.6, and (b) 0.6 < |η| < 1.1, obtained after subtraction of corresponding estimates of
neutral particle response, versus track momentum. Tracks with no matching energy cluster in the
calorimeter are included. The bottom portion of the panels shows the ratio of simulation (using
GEANT4 version 9.4 and two physics lists) to data. Error bars are statistical. Reproduced from
[115] under the Creative Commons License 4.0
Fig. 11.8 Correction factor from comparison of γ/W + jet events in CMS 2010 data at
√
s = 7 TeV. From Ref. [116], reproduced under the Creative Commons license 3.0