

7 Particle Detectors and Detector Systems
321
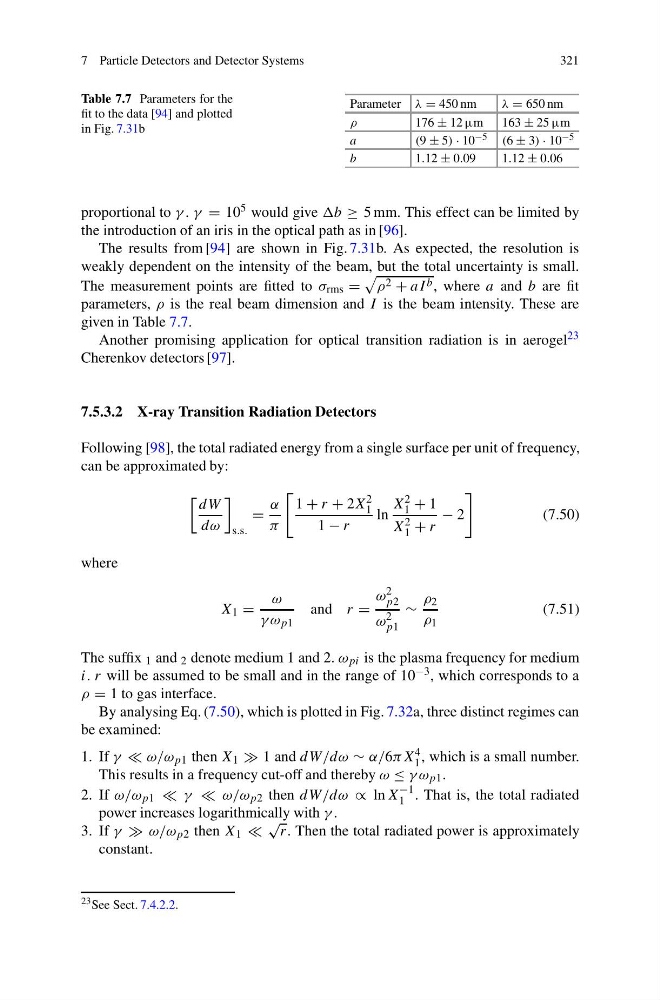
Table 7.7 Parameters for the
fit to the data [94] and plotted
in Fig. 7.31b
Parameter λ = 450 nm
λ = 650 nm
ρ
176 ± 12 μm 163 ± 25 μm
a
(9 ± 5) · 10 −5 (6 ± 3) · 10 −5
b
1.12 ± 0.09
1.12 ± 0.06
proportional to γ . γ = 10 5 would give ≥ 5 mm. This effect can be limited by
the introduction of an iris in the optical path as in [96].
The results from [94] are shown in Fig. 7.31b. As expected, the resolution is
weakly dependent on the intensity of the beam, but the total uncertainty is small.
The measurement points are fitted to σ rms =
ρ 2 + aI b , where a and b are fit
parameters, ρ is the real beam dimension and I is the beam intensity. These are
given in Table 7.7.
Another promising application for optical transition radiation is in aerogel 23
Cherenkov detectors [97].
7.5.3.2 X-ray Transition Radiation Detectors
Following [98], the total radiated energy from a single surface per unit of frequency,
can be approximated by:
dW
dω
s.s.
=
α
π
1 + r + 2X 2
1
1 − r
ln
X 2
1 + 1
X 2
1 + r
− 2
(7.50)
where
X 1 =
ω
γ ω p1
and r =
ω 2
p2
ω 2
p1
∼
ρ 2
ρ 1
(7.51)
The suffix 1 and 2 denote medium 1 and 2. ω pi is the plasma frequency for medium
i. r will be assumed to be small and in the range of 10 −3 , which corresponds to a
ρ = 1 to gas interface.
By analysing Eq. (7.50), which is plotted in Fig. 7.32a, three distinct regimes can
be examined:
1. If γ ω/ω p1 then X 1 1 and dW/dω ∼ α/6πX 4
1 , which is a small number.
This results in a frequency cut-off and thereby ω ≤ γ ω p1 .
2. If ω/ω p1 γ ω/ω p2 then dW/dω ∝ ln X
−1
1 . That is, the total radiated
power increases logarithmically with γ .
3. If γ ω/ω p2 then X 1
√
r. Then the total radiated power is approximately
constant.
23 See Sect. 7.4.2.2.
321
Table 7.7 Parameters for the
fit to the data [94] and plotted
in Fig. 7.31b
Parameter λ = 450 nm
λ = 650 nm
ρ
176 ± 12 μm 163 ± 25 μm
a
(9 ± 5) · 10 −5 (6 ± 3) · 10 −5
b
1.12 ± 0.09
1.12 ± 0.06
proportional to γ . γ = 10 5 would give ≥ 5 mm. This effect can be limited by
the introduction of an iris in the optical path as in [96].
The results from [94] are shown in Fig. 7.31b. As expected, the resolution is
weakly dependent on the intensity of the beam, but the total uncertainty is small.
The measurement points are fitted to σ rms =
ρ 2 + aI b , where a and b are fit
parameters, ρ is the real beam dimension and I is the beam intensity. These are
given in Table 7.7.
Another promising application for optical transition radiation is in aerogel 23
Cherenkov detectors [97].
7.5.3.2 X-ray Transition Radiation Detectors
Following [98], the total radiated energy from a single surface per unit of frequency,
can be approximated by:
dW
dω
s.s.
=
α
π
1 + r + 2X 2
1
1 − r
ln
X 2
1 + 1
X 2
1 + r
− 2
(7.50)
where
X 1 =
ω
γ ω p1
and r =
ω 2
p2
ω 2
p1
∼
ρ 2
ρ 1
(7.51)
The suffix 1 and 2 denote medium 1 and 2. ω pi is the plasma frequency for medium
i. r will be assumed to be small and in the range of 10 −3 , which corresponds to a
ρ = 1 to gas interface.
By analysing Eq. (7.50), which is plotted in Fig. 7.32a, three distinct regimes can
be examined:
1. If γ ω/ω p1 then X 1 1 and dW/dω ∼ α/6πX 4
1 , which is a small number.
This results in a frequency cut-off and thereby ω ≤ γ ω p1 .
2. If ω/ω p1 γ ω/ω p2 then dW/dω ∝ ln X
−1
1 . That is, the total radiated
power increases logarithmically with γ .
3. If γ ω/ω p2 then X 1
√
r. Then the total radiated power is approximately
constant.
23 See Sect. 7.4.2.2.