

310
R. Forty and O. Ullaland
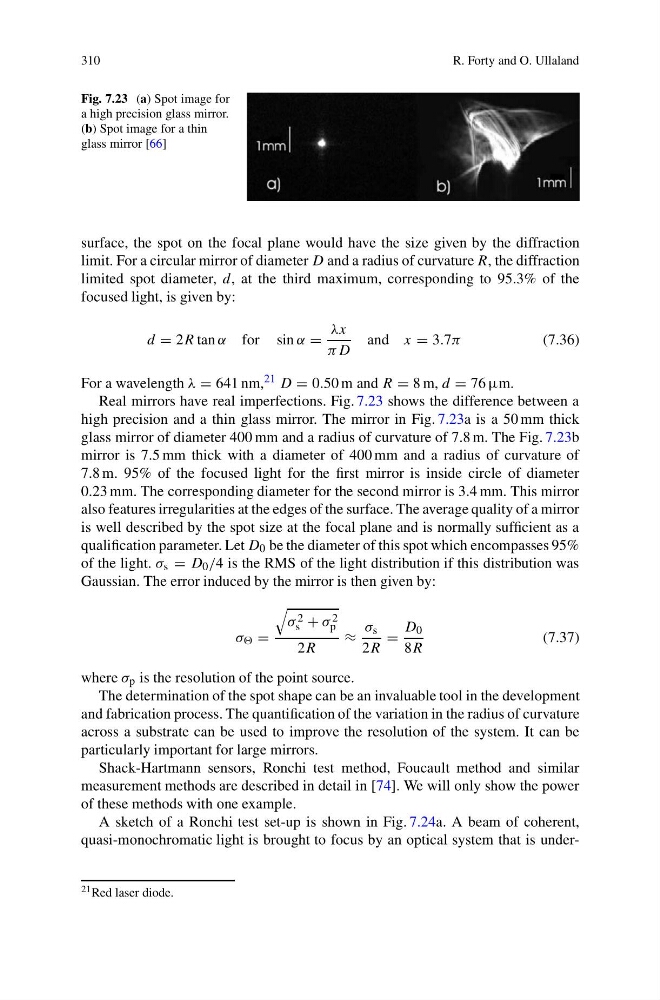
Fig. 7.23 (a) Spot image for
a high precision glass mirror.
(b) Spot image for a thin
glass mirror [66]
surface, the spot on the focal plane would have the size given by the diffraction
limit. For a circular mirror of diameter D and a radius of curvature R, the diffraction
limited spot diameter, d, at the third maximum, corresponding to 95.3% of the
focused light, is given by:
d = 2R tan α for sin α =
λx
πD
and x = 3.7π
(7.36)
For a wavelength λ = 641 nm, 21 D = 0.50 m and R = 8 m, d = 76 μm.
Real mirrors have real imperfections. Fig. 7.23 shows the difference between a
high precision and a thin glass mirror. The mirror in Fig. 7.23a is a 50 mm thick
glass mirror of diameter 400 mm and a radius of curvature of 7.8 m. The Fig. 7.23b
mirror is 7.5 mm thick with a diameter of 400 mm and a radius of curvature of
7.8 m. 95% of the focused light for the first mirror is inside circle of diameter
0.23 mm. The corresponding diameter for the second mirror is 3.4 mm. This mirror
also features irregularities at the edges of the surface. The average quality of a mirror
is well described by the spot size at the focal plane and is normally sufficient as a
qualification parameter. Let D 0 be the diameter of this spot which encompasses 95%
of the light. σ s = D 0 /4 is the RMS of the light distribution if this distribution was
Gaussian. The error induced by the mirror is then given by:
σ =
σ 2
s + σ 2
p
2R
≈
σ s
2R
=
D 0
8R
(7.37)
where σ p is the resolution of the point source.
The determination of the spot shape can be an invaluable tool in the development
and fabrication process. The quantification of the variation in the radius of curvature
across a substrate can be used to improve the resolution of the system. It can be
particularly important for large mirrors.
Shack-Hartmann sensors, Ronchi test method, Foucault method and similar
measurement methods are described in detail in [74]. We will only show the power
of these methods with one example.
A sketch of a Ronchi test set-up is shown in Fig. 7.24a. A beam of coherent,
quasi-monochromatic light is brought to focus by an optical system that is under21 Red laser diode.
R. Forty and O. Ullaland
Fig. 7.23 (a) Spot image for
a high precision glass mirror.
(b) Spot image for a thin
glass mirror [66]
surface, the spot on the focal plane would have the size given by the diffraction
limit. For a circular mirror of diameter D and a radius of curvature R, the diffraction
limited spot diameter, d, at the third maximum, corresponding to 95.3% of the
focused light, is given by:
d = 2R tan α for sin α =
λx
πD
and x = 3.7π
(7.36)
For a wavelength λ = 641 nm, 21 D = 0.50 m and R = 8 m, d = 76 μm.
Real mirrors have real imperfections. Fig. 7.23 shows the difference between a
high precision and a thin glass mirror. The mirror in Fig. 7.23a is a 50 mm thick
glass mirror of diameter 400 mm and a radius of curvature of 7.8 m. The Fig. 7.23b
mirror is 7.5 mm thick with a diameter of 400 mm and a radius of curvature of
7.8 m. 95% of the focused light for the first mirror is inside circle of diameter
0.23 mm. The corresponding diameter for the second mirror is 3.4 mm. This mirror
also features irregularities at the edges of the surface. The average quality of a mirror
is well described by the spot size at the focal plane and is normally sufficient as a
qualification parameter. Let D 0 be the diameter of this spot which encompasses 95%
of the light. σ s = D 0 /4 is the RMS of the light distribution if this distribution was
Gaussian. The error induced by the mirror is then given by:
σ =
σ 2
s + σ 2
p
2R
≈
σ s
2R
=
D 0
8R
(7.37)
where σ p is the resolution of the point source.
The determination of the spot shape can be an invaluable tool in the development
and fabrication process. The quantification of the variation in the radius of curvature
across a substrate can be used to improve the resolution of the system. It can be
particularly important for large mirrors.
Shack-Hartmann sensors, Ronchi test method, Foucault method and similar
measurement methods are described in detail in [74]. We will only show the power
of these methods with one example.
A sketch of a Ronchi test set-up is shown in Fig. 7.24a. A beam of coherent,
quasi-monochromatic light is brought to focus by an optical system that is under21 Red laser diode.