

296
R. Forty and O. Ullaland
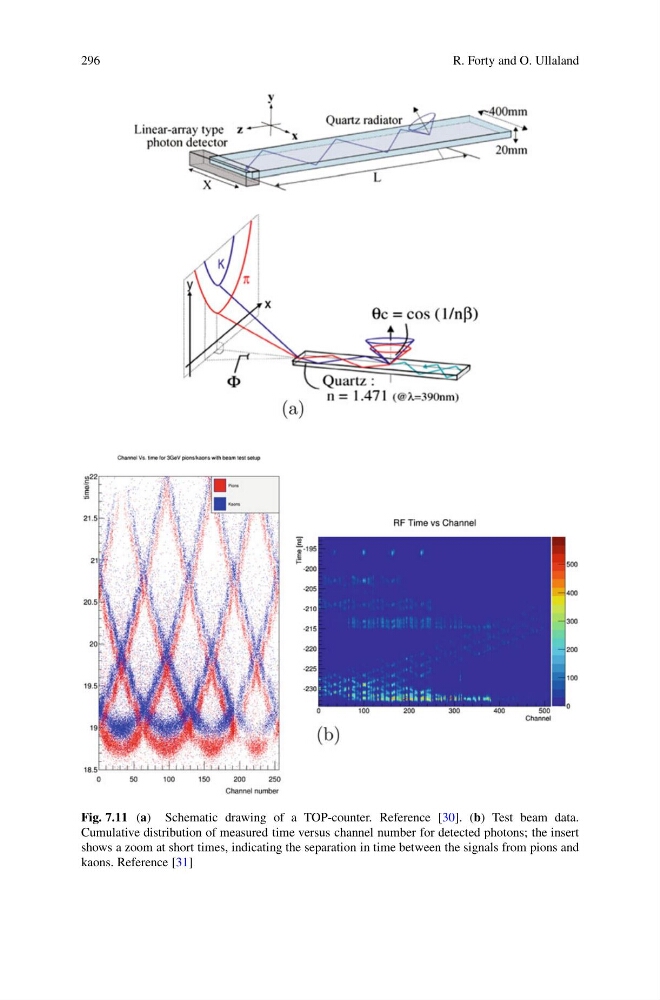
Fig. 7.11 (a) Schematic drawing of a TOP-counter. Reference [30]. (b) Test beam data.
Cumulative distribution of measured time versus channel number for detected photons; the insert
shows a zoom at short times, indicating the separation in time between the signals from pions and
kaons. Reference [31]
R. Forty and O. Ullaland
Fig. 7.11 (a) Schematic drawing of a TOP-counter. Reference [30]. (b) Test beam data.
Cumulative distribution of measured time versus channel number for detected photons; the insert
shows a zoom at short times, indicating the separation in time between the signals from pions and
kaons. Reference [31]