

212
C. W. Fabjan and D. Fournier
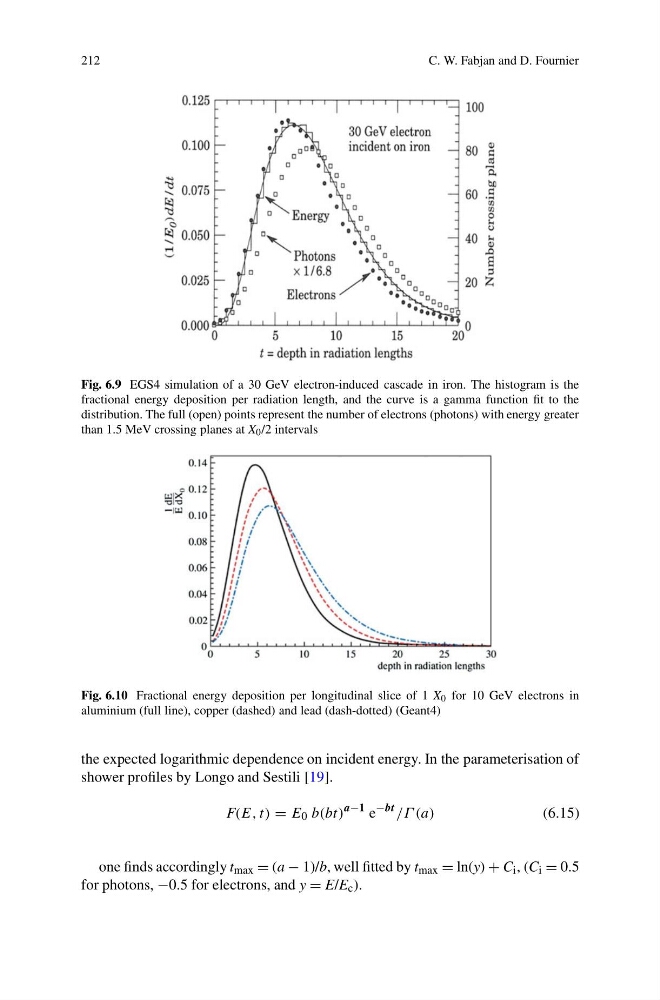
Fig. 6.9 EGS4 simulation of a 30 GeV electron-induced cascade in iron. The histogram is the
fractional energy deposition per radiation length, and the curve is a gamma function fit to the
distribution. The full (open) points represent the number of electrons (photons) with energy greater
than 1.5 MeV crossing planes at X 0 /2 intervals
Fig. 6.10 Fractional energy deposition per longitudinal slice of 1 X 0 for 10 GeV electrons in
aluminium (full line), copper (dashed) and lead (dash-dotted) (Geant4)
the expected logarithmic dependence on incident energy. In the parameterisation of
shower profiles by Longo and Sestili [19].
F(E, t) = E 0 b(bt)
a−1 e
−bt /Γ (a)
(6.15)
one finds accordingly t max = (a − 1)/b, well fitted by t max = ln(y) + C i , (C i = 0.5
for photons, −0.5 for electrons, and y = E/E c ).
C. W. Fabjan and D. Fournier
Fig. 6.9 EGS4 simulation of a 30 GeV electron-induced cascade in iron. The histogram is the
fractional energy deposition per radiation length, and the curve is a gamma function fit to the
distribution. The full (open) points represent the number of electrons (photons) with energy greater
than 1.5 MeV crossing planes at X 0 /2 intervals
Fig. 6.10 Fractional energy deposition per longitudinal slice of 1 X 0 for 10 GeV electrons in
aluminium (full line), copper (dashed) and lead (dash-dotted) (Geant4)
the expected logarithmic dependence on incident energy. In the parameterisation of
shower profiles by Longo and Sestili [19].
F(E, t) = E 0 b(bt)
a−1 e
−bt /Γ (a)
(6.15)
one finds accordingly t max = (a − 1)/b, well fitted by t max = ln(y) + C i , (C i = 0.5
for photons, −0.5 for electrons, and y = E/E c ).