

192
G. Lutz and R. Klanner
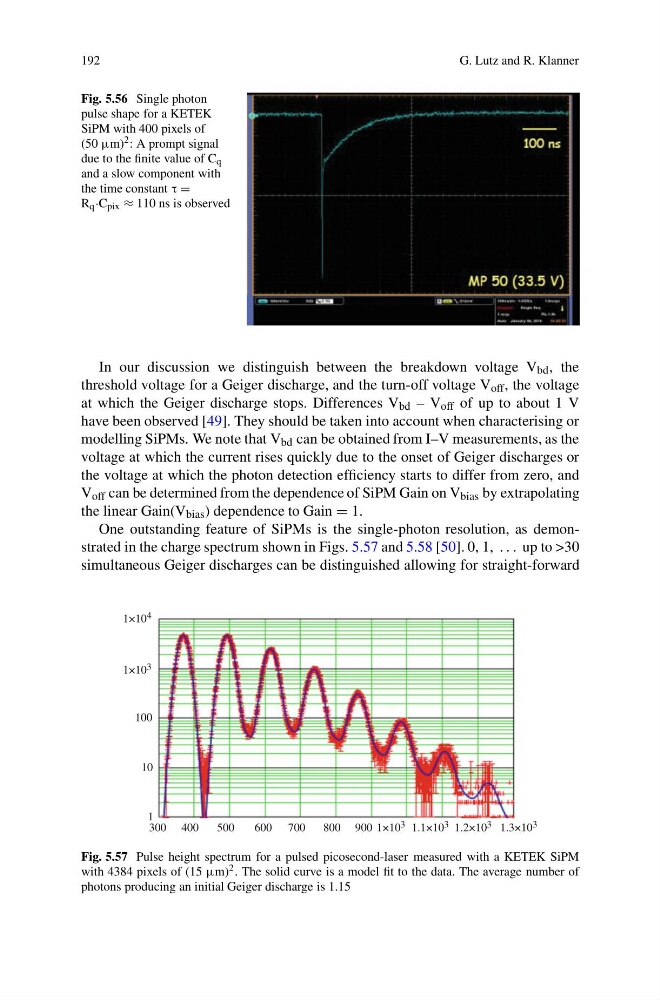
Fig. 5.56 Single photon
pulse shape for a KETEK
SiPM with 400 pixels of
(50 μm) 2 : A prompt signal
due to the finite value of C q
and a slow component with
the time constant τ =
R q ·C pix ≈ 110 ns is observed
In our discussion we distinguish between the breakdown voltage V bd , the
threshold voltage for a Geiger discharge, and the turn-off voltage V off , the voltage
at which the Geiger discharge stops. Differences V bd – V off of up to about 1 V
have been observed [49]. They should be taken into account when characterising or
modelling SiPMs. We note that V bd can be obtained from I–V measurements, as the
voltage at which the current rises quickly due to the onset of Geiger discharges or
the voltage at which the photon detection efficiency starts to differ from zero, and
V off can be determined from the dependence of SiPM Gain on V bias by extrapolating
the linear Gain(V bias ) dependence to Gain = 1.
One outstanding feature of SiPMs is the single-photon resolution, as demonstrated in the charge spectrum shown in Figs. 5.57 and 5.58 [50]. 0, 1, . . . up to >30
simultaneous Geiger discharges can be distinguished allowing for straight-forward
1×10 4
1×10 3 1.1×10 3 1.2×10 3 1.3×10 3
1×10 3
100
10
1
300 400
500
600 700
800 900
Fig. 5.57 Pulse height spectrum for a pulsed picosecond-laser measured with a KETEK SiPM
with 4384 pixels of (15 μm) 2 . The solid curve is a model fit to the data. The average number of
photons producing an initial Geiger discharge is 1.15
G. Lutz and R. Klanner
Fig. 5.56 Single photon
pulse shape for a KETEK
SiPM with 400 pixels of
(50 μm) 2 : A prompt signal
due to the finite value of C q
and a slow component with
the time constant τ =
R q ·C pix ≈ 110 ns is observed
In our discussion we distinguish between the breakdown voltage V bd , the
threshold voltage for a Geiger discharge, and the turn-off voltage V off , the voltage
at which the Geiger discharge stops. Differences V bd – V off of up to about 1 V
have been observed [49]. They should be taken into account when characterising or
modelling SiPMs. We note that V bd can be obtained from I–V measurements, as the
voltage at which the current rises quickly due to the onset of Geiger discharges or
the voltage at which the photon detection efficiency starts to differ from zero, and
V off can be determined from the dependence of SiPM Gain on V bias by extrapolating
the linear Gain(V bias ) dependence to Gain = 1.
One outstanding feature of SiPMs is the single-photon resolution, as demonstrated in the charge spectrum shown in Figs. 5.57 and 5.58 [50]. 0, 1, . . . up to >30
simultaneous Geiger discharges can be distinguished allowing for straight-forward
1×10 4
1×10 3 1.1×10 3 1.2×10 3 1.3×10 3
1×10 3
100
10
1
300 400
500
600 700
800 900
Fig. 5.57 Pulse height spectrum for a pulsed picosecond-laser measured with a KETEK SiPM
with 4384 pixels of (15 μm) 2 . The solid curve is a model fit to the data. The average number of
photons producing an initial Geiger discharge is 1.15