

4 Impedance and Collective Effects
163
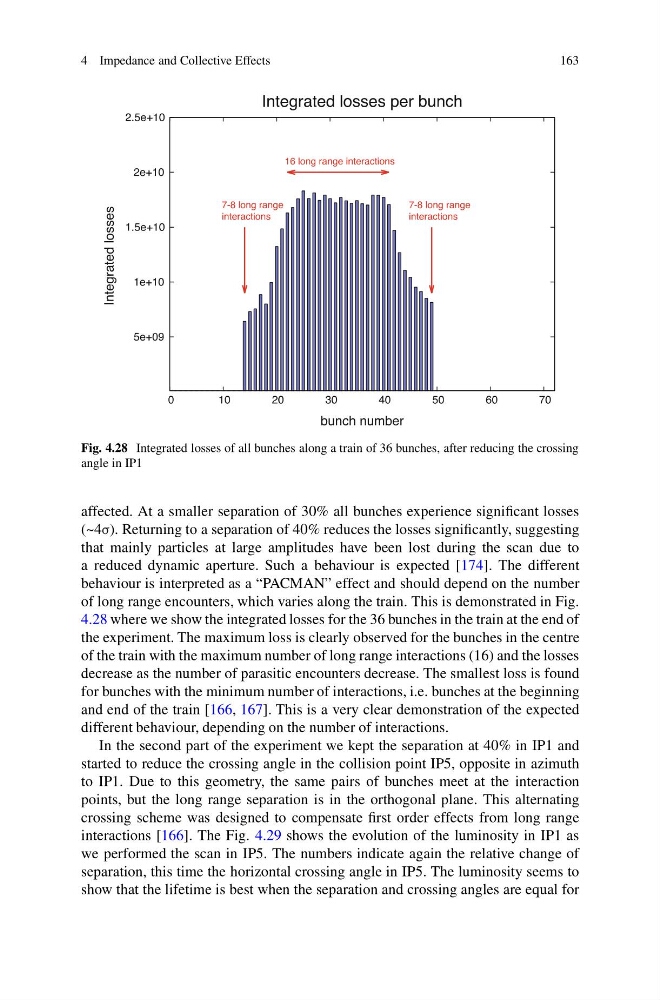
Fig. 4.28 Integrated losses of all bunches along a train of 36 bunches, after reducing the crossing
angle in IP1
affected. At a smaller separation of 30% all bunches experience significant losses
(~4σ). Returning to a separation of 40% reduces the losses significantly, suggesting
that mainly particles at large amplitudes have been lost during the scan due to
a reduced dynamic aperture. Such a behaviour is expected [174]. The different
behaviour is interpreted as a “PACMAN” effect and should depend on the number
of long range encounters, which varies along the train. This is demonstrated in Fig.
4.28 where we show the integrated losses for the 36 bunches in the train at the end of
the experiment. The maximum loss is clearly observed for the bunches in the centre
of the train with the maximum number of long range interactions (16) and the losses
decrease as the number of parasitic encounters decrease. The smallest loss is found
for bunches with the minimum number of interactions, i.e. bunches at the beginning
and end of the train [166, 167]. This is a very clear demonstration of the expected
different behaviour, depending on the number of interactions.
In the second part of the experiment we kept the separation at 40% in IP1 and
started to reduce the crossing angle in the collision point IP5, opposite in azimuth
to IP1. Due to this geometry, the same pairs of bunches meet at the interaction
points, but the long range separation is in the orthogonal plane. This alternating
crossing scheme was designed to compensate first order effects from long range
interactions [166]. The Fig. 4.29 shows the evolution of the luminosity in IP1 as
we performed the scan in IP5. The numbers indicate again the relative change of
separation, this time the horizontal crossing angle in IP5. The luminosity seems to
show that the lifetime is best when the separation and crossing angles are equal for
163
Fig. 4.28 Integrated losses of all bunches along a train of 36 bunches, after reducing the crossing
angle in IP1
affected. At a smaller separation of 30% all bunches experience significant losses
(~4σ). Returning to a separation of 40% reduces the losses significantly, suggesting
that mainly particles at large amplitudes have been lost during the scan due to
a reduced dynamic aperture. Such a behaviour is expected [174]. The different
behaviour is interpreted as a “PACMAN” effect and should depend on the number
of long range encounters, which varies along the train. This is demonstrated in Fig.
4.28 where we show the integrated losses for the 36 bunches in the train at the end of
the experiment. The maximum loss is clearly observed for the bunches in the centre
of the train with the maximum number of long range interactions (16) and the losses
decrease as the number of parasitic encounters decrease. The smallest loss is found
for bunches with the minimum number of interactions, i.e. bunches at the beginning
and end of the train [166, 167]. This is a very clear demonstration of the expected
different behaviour, depending on the number of interactions.
In the second part of the experiment we kept the separation at 40% in IP1 and
started to reduce the crossing angle in the collision point IP5, opposite in azimuth
to IP1. Due to this geometry, the same pairs of bunches meet at the interaction
points, but the long range separation is in the orthogonal plane. This alternating
crossing scheme was designed to compensate first order effects from long range
interactions [166]. The Fig. 4.29 shows the evolution of the luminosity in IP1 as
we performed the scan in IP5. The numbers indicate again the relative change of
separation, this time the horizontal crossing angle in IP5. The luminosity seems to
show that the lifetime is best when the separation and crossing angles are equal for