

162
E. Metral et al.
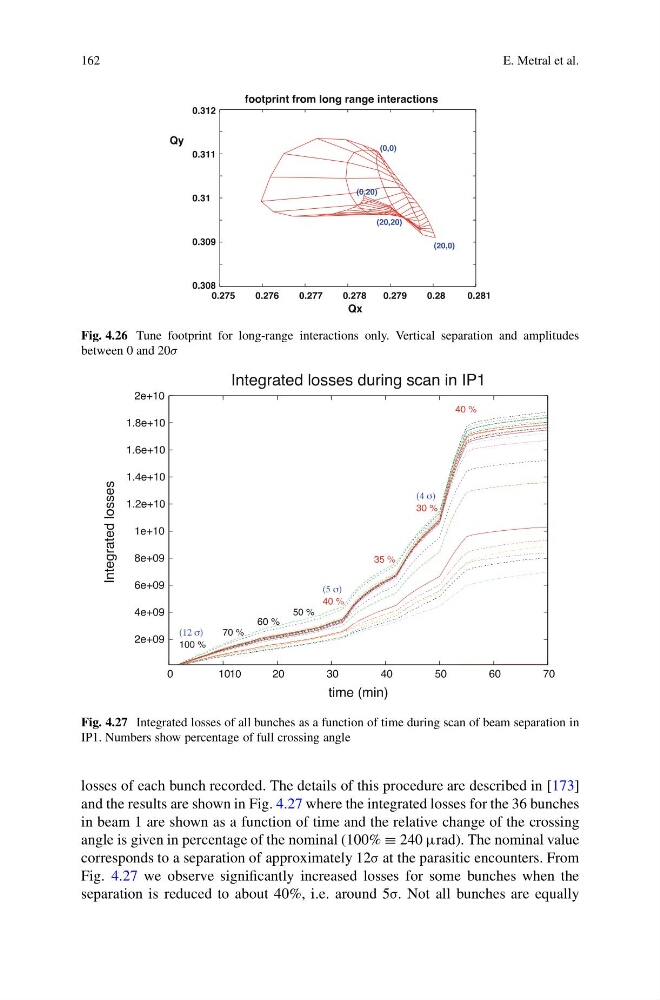
Fig. 4.26 Tune footprint for long-range interactions only. Vertical separation and amplitudes
between 0 and 20σ
10
Fig. 4.27 Integrated losses of all bunches as a function of time during scan of beam separation in
IP1. Numbers show percentage of full crossing angle
losses of each bunch recorded. The details of this procedure are described in [173]
and the results are shown in Fig. 4.27 where the integrated losses for the 36 bunches
in beam 1 are shown as a function of time and the relative change of the crossing
angle is given in percentage of the nominal (100% ≡ 240 μrad). The nominal value
corresponds to a separation of approximately 12σ at the parasitic encounters. From
Fig. 4.27 we observe significantly increased losses for some bunches when the
separation is reduced to about 40%, i.e. around 5σ. Not all bunches are equally
E. Metral et al.
Fig. 4.26 Tune footprint for long-range interactions only. Vertical separation and amplitudes
between 0 and 20σ
10
Fig. 4.27 Integrated losses of all bunches as a function of time during scan of beam separation in
IP1. Numbers show percentage of full crossing angle
losses of each bunch recorded. The details of this procedure are described in [173]
and the results are shown in Fig. 4.27 where the integrated losses for the 36 bunches
in beam 1 are shown as a function of time and the relative change of the crossing
angle is given in percentage of the nominal (100% ≡ 240 μrad). The nominal value
corresponds to a separation of approximately 12σ at the parasitic encounters. From
Fig. 4.27 we observe significantly increased losses for some bunches when the
separation is reduced to about 40%, i.e. around 5σ. Not all bunches are equally