

Result of Set Covering Model Besides the utility of candidate places, the distance
between the location of distribution centers and service applicants also affects the
quality of service provided by distribution centers. Therefore, the geographical
distribution should be also considered in the location selection of such centers. To
satisfy this point, a multi-objective set covering model is applied in this research. We
solve some examples to analyze the performance of the proposed model. To this end,
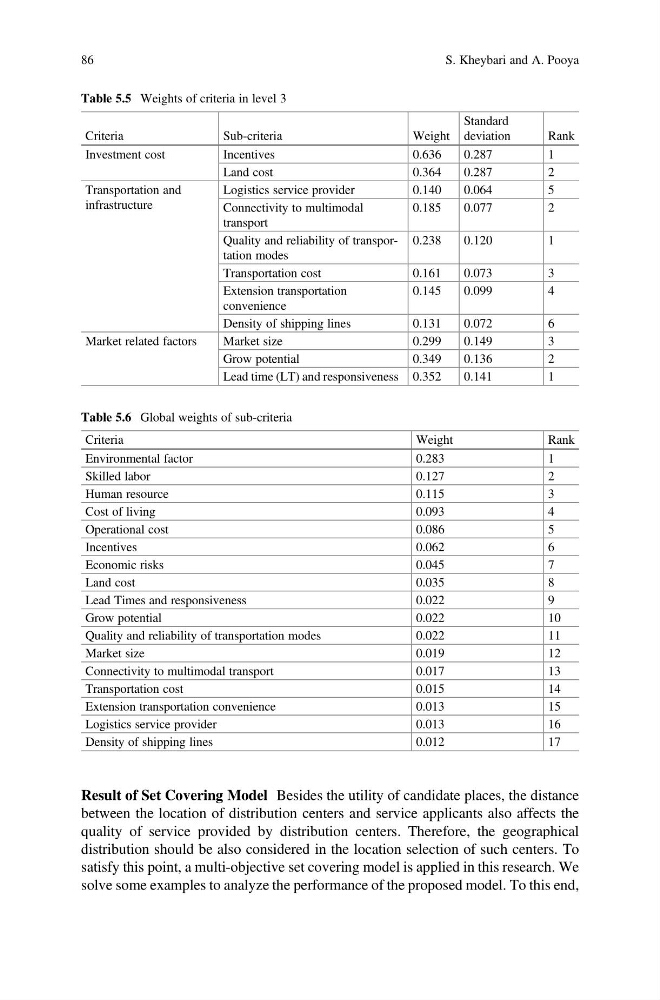
Table 5.5 Weights of criteria in level 3
Criteria
Sub-criteria
Weight
Standard
deviation
Rank
Investment cost
Incentives
0.636
0.287
1
Land cost
0.364
0.287
2
Transportation and
infrastructure
Logistics service provider
0.140
0.064
5
Connectivity to multimodal
transport
0.185
0.077
2
Quality and reliability of transportation modes
0.238
0.120
1
Transportation cost
0.161
0.073
3
Extension transportation
convenience
0.145
0.099
4
Density of shipping lines
0.131
0.072
6
Market related factors
Market size
0.299
0.149
3
Grow potential
0.349
0.136
2
Lead time (LT) and responsiveness 0.352
0.141
1
Table 5.6 Global weights of sub-criteria
Criteria
Weight
Rank
Environmental factor
0.283
1
Skilled labor
0.127
2
Human resource
0.115
3
Cost of living
0.093
4
Operational cost
0.086
5
Incentives
0.062
6
Economic risks
0.045
7
Land cost
0.035
8
Lead Times and responsiveness
0.022
9
Grow potential
0.022
10
Quality and reliability of transportation modes
0.022
11
Market size
0.019
12
Connectivity to multimodal transport
0.017
13
Transportation cost
0.015
14
Extension transportation convenience
0.013
15
Logistics service provider
0.013
16
Density of shipping lines
0.012
17
86
S. Kheybari and A. Pooya
between the location of distribution centers and service applicants also affects the
quality of service provided by distribution centers. Therefore, the geographical
distribution should be also considered in the location selection of such centers. To
satisfy this point, a multi-objective set covering model is applied in this research. We
solve some examples to analyze the performance of the proposed model. To this end,
Table 5.5 Weights of criteria in level 3
Criteria
Sub-criteria
Weight
Standard
deviation
Rank
Investment cost
Incentives
0.636
0.287
1
Land cost
0.364
0.287
2
Transportation and
infrastructure
Logistics service provider
0.140
0.064
5
Connectivity to multimodal
transport
0.185
0.077
2
Quality and reliability of transportation modes
0.238
0.120
1
Transportation cost
0.161
0.073
3
Extension transportation
convenience
0.145
0.099
4
Density of shipping lines
0.131
0.072
6
Market related factors
Market size
0.299
0.149
3
Grow potential
0.349
0.136
2
Lead time (LT) and responsiveness 0.352
0.141
1
Table 5.6 Global weights of sub-criteria
Criteria
Weight
Rank
Environmental factor
0.283
1
Skilled labor
0.127
2
Human resource
0.115
3
Cost of living
0.093
4
Operational cost
0.086
5
Incentives
0.062
6
Economic risks
0.045
7
Land cost
0.035
8
Lead Times and responsiveness
0.022
9
Grow potential
0.022
10
Quality and reliability of transportation modes
0.022
11
Market size
0.019
12
Connectivity to multimodal transport
0.017
13
Transportation cost
0.015
14
Extension transportation convenience
0.013
15
Logistics service provider
0.013
16
Density of shipping lines
0.012
17
86
S. Kheybari and A. Pooya