

centers and lead times provided by each service provider. So, when there is a large
area that should be covered by specific number of distribution centers, the candidate
places that provide service to a greater number of service applicants are considered
as high potential alternatives. Based on experts’ opinion, grow potential and market
size are the other two important sub-criteria in this category (see Table 5.5).
To calculate the utility score of each province, we calculate the global weight of
sub-criteria presented in the last level of Fig. 5.4 (see Table 5.6).
As Table 5.6 indicates, the environmental factor, skilled labor, human resource,
and cost of living are the first four sub-criteria that together account for about 60% of
the total weight (see Table 5.6). After calculating the global weight of sub-criteria,
the utility of alternatives, provinces of Iran, is determined based on Eq. 5.3. To this
end, we collected the value of provinces of Iran (i.e., x ij in Eqs. 5.4 and 5.5) with
respect to the selected criteria from different databases including Statistical Center of
Iran, the Ministry of Culture and Islamic Guidance, and Ministry of Petroleum. The
result of this step is presented in Table 5.7.
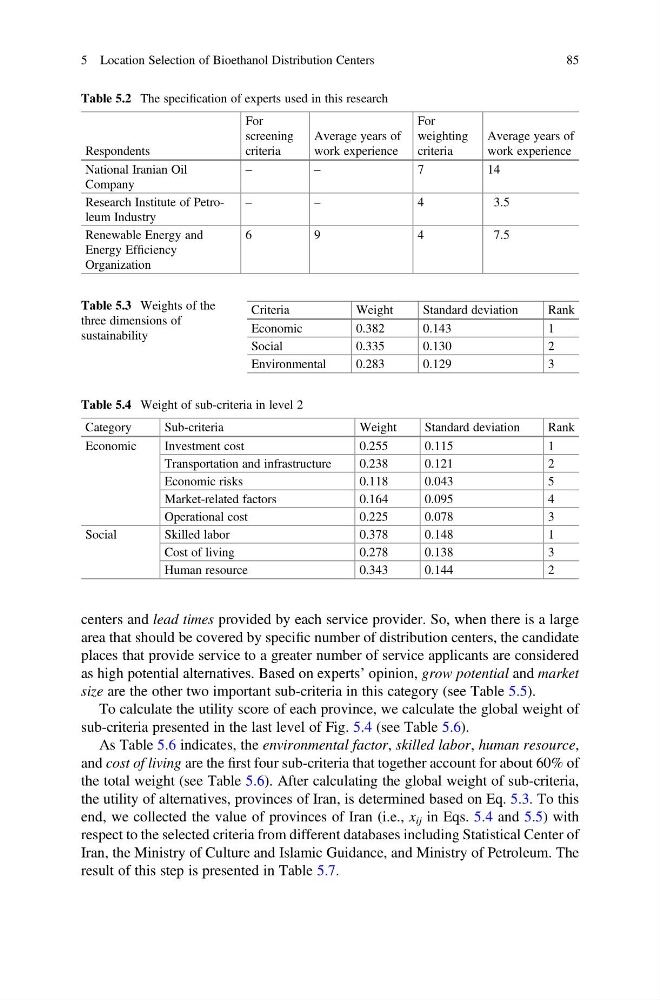
Table 5.2 The specification of experts used in this research
Respondents
For
screening
criteria
Average years of
work experience
For
weighting
criteria
Average years of
work experience
National Iranian Oil
Company
–
–
7
1 4
Research Institute of Petroleum Industry
–
–
4
3.5
Renewable Energy and
Energy Efficiency
Organization
6
9
4
7.5
Table 5.3 Weights of the
three dimensions of
sustainability
Criteria
Weight
Standard deviation
Rank
Economic
0.382
0.143
1
Social
0.335
0.130
2
Environmental
0.283
0.129
3
Table 5.4 Weight of sub-criteria in level 2
Category
Sub-criteria
Weight
Standard deviation
Rank
Economic
Investment cost
0.255
0.115
1
Transportation and infrastructure
0.238
0.121
2
Economic risks
0.118
0.043
5
Market-related factors
0.164
0.095
4
Operational cost
0.225
0.078
3
Social
Skilled labor
0.378
0.148
1
Cost of living
0.278
0.138
3
Human resource
0.343
0.144
2
5 Location Selection of Bioethanol Distribution Centers
85
area that should be covered by specific number of distribution centers, the candidate
places that provide service to a greater number of service applicants are considered
as high potential alternatives. Based on experts’ opinion, grow potential and market
size are the other two important sub-criteria in this category (see Table 5.5).
To calculate the utility score of each province, we calculate the global weight of
sub-criteria presented in the last level of Fig. 5.4 (see Table 5.6).
As Table 5.6 indicates, the environmental factor, skilled labor, human resource,
and cost of living are the first four sub-criteria that together account for about 60% of
the total weight (see Table 5.6). After calculating the global weight of sub-criteria,
the utility of alternatives, provinces of Iran, is determined based on Eq. 5.3. To this
end, we collected the value of provinces of Iran (i.e., x ij in Eqs. 5.4 and 5.5) with
respect to the selected criteria from different databases including Statistical Center of
Iran, the Ministry of Culture and Islamic Guidance, and Ministry of Petroleum. The
result of this step is presented in Table 5.7.
Table 5.2 The specification of experts used in this research
Respondents
For
screening
criteria
Average years of
work experience
For
weighting
criteria
Average years of
work experience
National Iranian Oil
Company
–
–
7
1 4
Research Institute of Petroleum Industry
–
–
4
3.5
Renewable Energy and
Energy Efficiency
Organization
6
9
4
7.5
Table 5.3 Weights of the
three dimensions of
sustainability
Criteria
Weight
Standard deviation
Rank
Economic
0.382
0.143
1
Social
0.335
0.130
2
Environmental
0.283
0.129
3
Table 5.4 Weight of sub-criteria in level 2
Category
Sub-criteria
Weight
Standard deviation
Rank
Economic
Investment cost
0.255
0.115
1
Transportation and infrastructure
0.238
0.121
2
Economic risks
0.118
0.043
5
Market-related factors
0.164
0.095
4
Operational cost
0.225
0.078
3
Social
Skilled labor
0.378
0.148
1
Cost of living
0.278
0.138
3
Human resource
0.343
0.144
2
5 Location Selection of Bioethanol Distribution Centers
85