

we first evaluate the impact of coverage radius on the selected places, and then
through some sensitivity analysis done on the weight of objective functions, the
output of model is assessed. Note that (i) the value of a di in all examples is calculated
based on the distance between provinces of Iran, and (ii) we use p¼1 in Eq. 5.11 for
all examples.
As presented in Table 5.8, by increasing the coverage radius, both cost allocated
to establish distribution centers (i.e., Z 2 ) and the utility of selected places are satisfied
simultaneously. It means that when there is not limitation in the coverage radius of
candidate places, the result provided by MCDM is to a great extent acceptable.
To evaluate the role of objective functions in the places selected for bioethanol
distribution centers, we solve the model for coverage radius 500. As Table 5.9
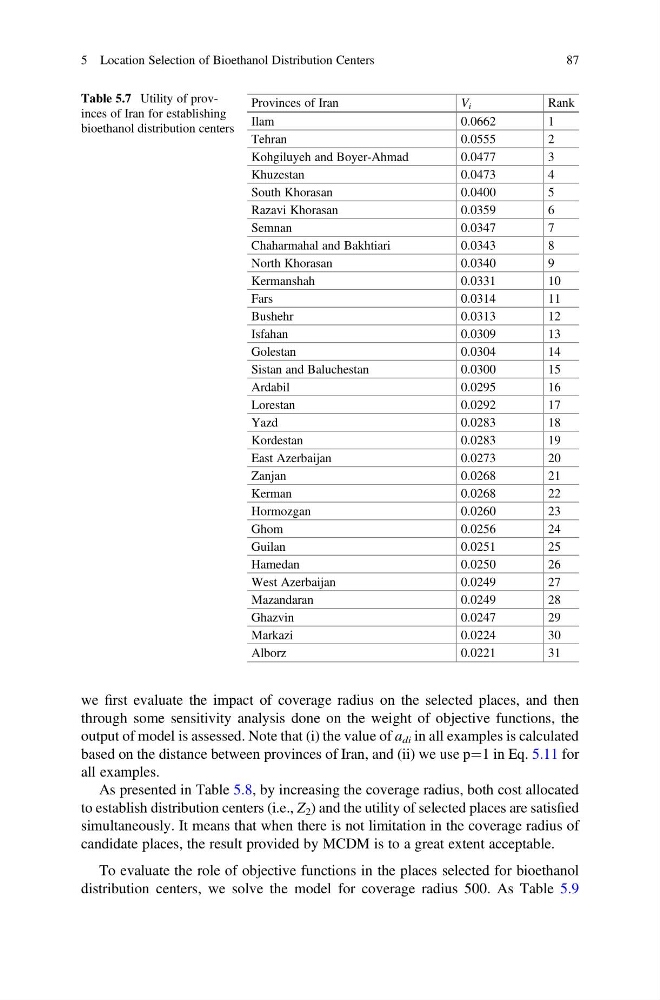
Table 5.7 Utility of provinces of Iran for establishing
bioethanol distribution centers
Provinces of Iran
V i
Rank
Ilam
0.0662
1
Tehran
0.0555
2
Kohgiluyeh and Boyer-Ahmad
0.0477
3
Khuzestan
0.0473
4
South Khorasan
0.0400
5
Razavi Khorasan
0.0359
6
Semnan
0.0347
7
Chaharmahal and Bakhtiari
0.0343
8
North Khorasan
0.0340
9
Kermanshah
0.0331
10
Fars
0.0314
11
Bushehr
0.0313
12
Isfahan
0.0309
13
Golestan
0.0304
14
Sistan and Baluchestan
0.0300
15
Ardabil
0.0295
16
Lorestan
0.0292
17
Yazd
0.0283
18
Kordestan
0.0283
19
East Azerbaijan
0.0273
20
Zanjan
0.0268
21
Kerman
0.0268
22
Hormozgan
0.0260
23
Ghom
0.0256
24
Guilan
0.0251
25
Hamedan
0.0250
26
West Azerbaijan
0.0249
27
Mazandaran
0.0249
28
Ghazvin
0.0247
29
Markazi
0.0224
30
Alborz
0.0221
31
5 Location Selection of Bioethanol Distribution Centers
87
through some sensitivity analysis done on the weight of objective functions, the
output of model is assessed. Note that (i) the value of a di in all examples is calculated
based on the distance between provinces of Iran, and (ii) we use p¼1 in Eq. 5.11 for
all examples.
As presented in Table 5.8, by increasing the coverage radius, both cost allocated
to establish distribution centers (i.e., Z 2 ) and the utility of selected places are satisfied
simultaneously. It means that when there is not limitation in the coverage radius of
candidate places, the result provided by MCDM is to a great extent acceptable.
To evaluate the role of objective functions in the places selected for bioethanol
distribution centers, we solve the model for coverage radius 500. As Table 5.9
Table 5.7 Utility of provinces of Iran for establishing
bioethanol distribution centers
Provinces of Iran
V i
Rank
Ilam
0.0662
1
Tehran
0.0555
2
Kohgiluyeh and Boyer-Ahmad
0.0477
3
Khuzestan
0.0473
4
South Khorasan
0.0400
5
Razavi Khorasan
0.0359
6
Semnan
0.0347
7
Chaharmahal and Bakhtiari
0.0343
8
North Khorasan
0.0340
9
Kermanshah
0.0331
10
Fars
0.0314
11
Bushehr
0.0313
12
Isfahan
0.0309
13
Golestan
0.0304
14
Sistan and Baluchestan
0.0300
15
Ardabil
0.0295
16
Lorestan
0.0292
17
Yazd
0.0283
18
Kordestan
0.0283
19
East Azerbaijan
0.0273
20
Zanjan
0.0268
21
Kerman
0.0268
22
Hormozgan
0.0260
23
Ghom
0.0256
24
Guilan
0.0251
25
Hamedan
0.0250
26
West Azerbaijan
0.0249
27
Mazandaran
0.0249
28
Ghazvin
0.0247
29
Markazi
0.0224
30
Alborz
0.0221
31
5 Location Selection of Bioethanol Distribution Centers
87