

78
M. Senami and A. Fukushima
−5.0
0.0
5.0
[bohr]
−5.0
0.0
5.0
[bohr]
−0.1
0.0
0.1
4
0.1
La
O
(a)
−5.0
0.0
5.0
[bohr]
−5.0
0.0
5.0
[bohr]
−0.1
0.0
0.1
4
0.1
La
O
(b)
−5.0
0.0
5.0
[bohr]
−5.0
0.0
5.0
[bohr]
−0.1
0.0
0.1
4
0.1
La
O
(c)
−0.05
0
1/4
0.15
i [−]
i =1
i =2
i =3
Average
0.0
1.0
La
O
|sin|
(d)
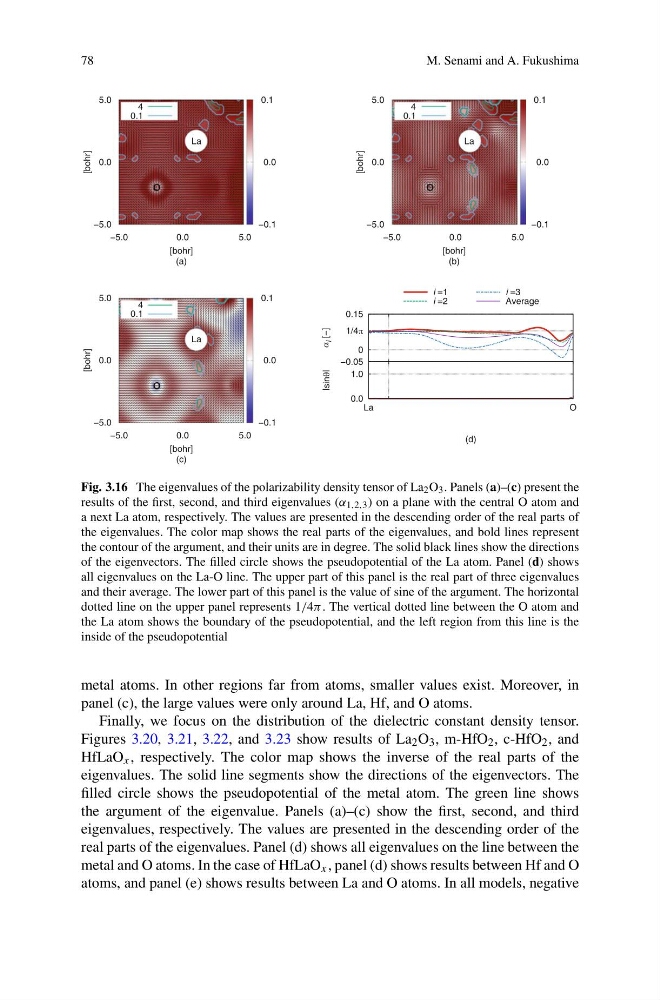
Fig. 3.16 The eigenvalues of the polarizability density tensor of La 2 O 3 . Panels (a)–(c) present the
results of the first, second, and third eigenvalues (α 1,2,3 ) on a plane with the central O atom and
a next La atom, respectively. The values are presented in the descending order of the real parts of
the eigenvalues. The color map shows the real parts of the eigenvalues, and bold lines represent
the contour of the argument, and their units are in degree. The solid black lines show the directions
of the eigenvectors. The filled circle shows the pseudopotential of the La atom. Panel (d) shows
all eigenvalues on the La-O line. The upper part of this panel is the real part of three eigenvalues
and their average. The lower part of this panel is the value of sine of the argument. The horizontal
dotted line on the upper panel represents 1/4π . The vertical dotted line between the O atom and
the La atom shows the boundary of the pseudopotential, and the left region from this line is the
inside of the pseudopotential
metal atoms. In other regions far from atoms, smaller values exist. Moreover, in
panel (c), the large values were only around La, Hf, and O atoms.
Finally, we focus on the distribution of the dielectric constant density tensor.
Figures 3.20, 3.21, 3.22, and 3.23 show results of La 2 O 3 , m-HfO 2 , c-HfO 2 , and
HfLaO x , respectively. The color map shows the inverse of the real parts of the
eigenvalues. The solid line segments show the directions of the eigenvectors. The
filled circle shows the pseudopotential of the metal atom. The green line shows
the argument of the eigenvalue. Panels (a)–(c) show the first, second, and third
eigenvalues, respectively. The values are presented in the descending order of the
real parts of the eigenvalues. Panel (d) shows all eigenvalues on the line between the
metal and O atoms. In the case of HfLaO x , panel (d) shows results between Hf and O
atoms, and panel (e) shows results between La and O atoms. In all models, negative
M. Senami and A. Fukushima
−5.0
0.0
5.0
[bohr]
−5.0
0.0
5.0
[bohr]
−0.1
0.0
0.1
4
0.1
La
O
(a)
−5.0
0.0
5.0
[bohr]
−5.0
0.0
5.0
[bohr]
−0.1
0.0
0.1
4
0.1
La
O
(b)
−5.0
0.0
5.0
[bohr]
−5.0
0.0
5.0
[bohr]
−0.1
0.0
0.1
4
0.1
La
O
(c)
−0.05
0
1/4
0.15
i [−]
i =1
i =2
i =3
Average
0.0
1.0
La
O
|sin|
(d)
Fig. 3.16 The eigenvalues of the polarizability density tensor of La 2 O 3 . Panels (a)–(c) present the
results of the first, second, and third eigenvalues (α 1,2,3 ) on a plane with the central O atom and
a next La atom, respectively. The values are presented in the descending order of the real parts of
the eigenvalues. The color map shows the real parts of the eigenvalues, and bold lines represent
the contour of the argument, and their units are in degree. The solid black lines show the directions
of the eigenvectors. The filled circle shows the pseudopotential of the La atom. Panel (d) shows
all eigenvalues on the La-O line. The upper part of this panel is the real part of three eigenvalues
and their average. The lower part of this panel is the value of sine of the argument. The horizontal
dotted line on the upper panel represents 1/4π . The vertical dotted line between the O atom and
the La atom shows the boundary of the pseudopotential, and the left region from this line is the
inside of the pseudopotential
metal atoms. In other regions far from atoms, smaller values exist. Moreover, in
panel (c), the large values were only around La, Hf, and O atoms.
Finally, we focus on the distribution of the dielectric constant density tensor.
Figures 3.20, 3.21, 3.22, and 3.23 show results of La 2 O 3 , m-HfO 2 , c-HfO 2 , and
HfLaO x , respectively. The color map shows the inverse of the real parts of the
eigenvalues. The solid line segments show the directions of the eigenvectors. The
filled circle shows the pseudopotential of the metal atom. The green line shows
the argument of the eigenvalue. Panels (a)–(c) show the first, second, and third
eigenvalues, respectively. The values are presented in the descending order of the
real parts of the eigenvalues. Panel (d) shows all eigenvalues on the line between the
metal and O atoms. In the case of HfLaO x , panel (d) shows results between Hf and O
atoms, and panel (e) shows results between La and O atoms. In all models, negative