

40
T. Onishi
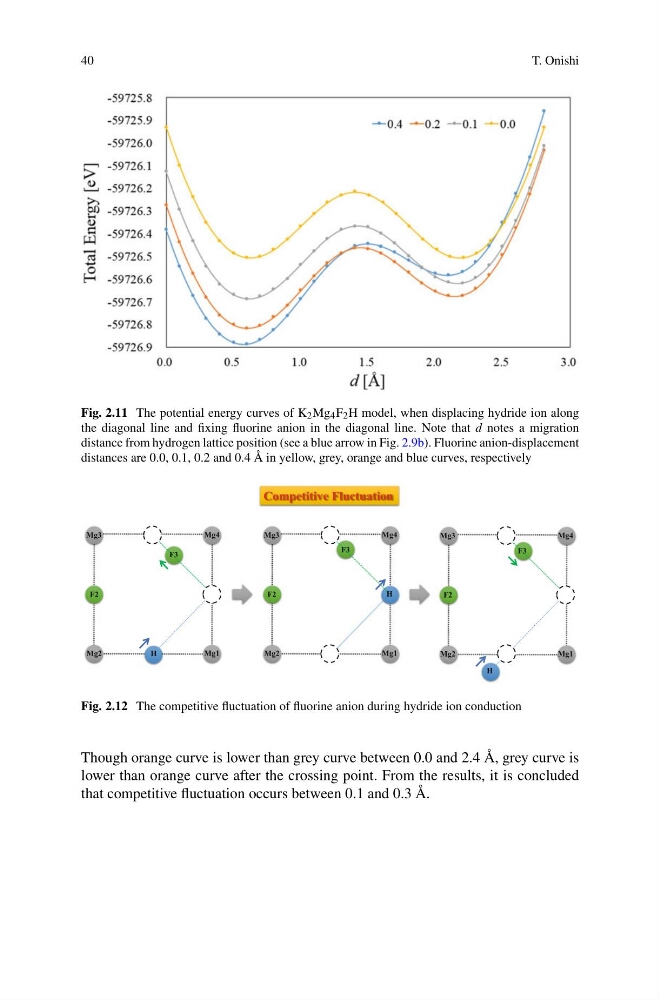
Fig. 2.11 The potential energy curves of K 2 Mg 4 F 2 H model, when displacing hydride ion along
the diagonal line and fixing fluorine anion in the diagonal line. Note that d notes a migration
distance from hydrogen lattice position (see a blue arrow in Fig. 2.9b). Fluorine anion-displacement
distances are 0.0, 0.1, 0.2 and 0.4 Å in yellow, grey, orange and blue curves, respectively
Competitive Fluctuation
F2
Mg3
H
Mg1
Mg2
Mg4
F3
F2
Mg3
H
Mg1
Mg2
Mg4
F3
F2
Mg3
H
Mg1
Mg2
Mg4
F3
Fig. 2.12 The competitive fluctuation of fluorine anion during hydride ion conduction
Though orange curve is lower than grey curve between 0.0 and 2.4 Å, grey curve is
lower than orange curve after the crossing point. From the results, it is concluded
that competitive fluctuation occurs between 0.1 and 0.3 Å.
T. Onishi
Fig. 2.11 The potential energy curves of K 2 Mg 4 F 2 H model, when displacing hydride ion along
the diagonal line and fixing fluorine anion in the diagonal line. Note that d notes a migration
distance from hydrogen lattice position (see a blue arrow in Fig. 2.9b). Fluorine anion-displacement
distances are 0.0, 0.1, 0.2 and 0.4 Å in yellow, grey, orange and blue curves, respectively
Competitive Fluctuation
F2
Mg3
H
Mg1
Mg2
Mg4
F3
F2
Mg3
H
Mg1
Mg2
Mg4
F3
F2
Mg3
H
Mg1
Mg2
Mg4
F3
Fig. 2.12 The competitive fluctuation of fluorine anion during hydride ion conduction
Though orange curve is lower than grey curve between 0.0 and 2.4 Å, grey curve is
lower than orange curve after the crossing point. From the results, it is concluded
that competitive fluctuation occurs between 0.1 and 0.3 Å.