

38
T. Onishi
(a)
FIX
F2
Mg3
H
Mg1
Mg2
Mg4
F3
(b)
FIX
F2
Mg3
H
Mg1
Mg2
Mg4
F3
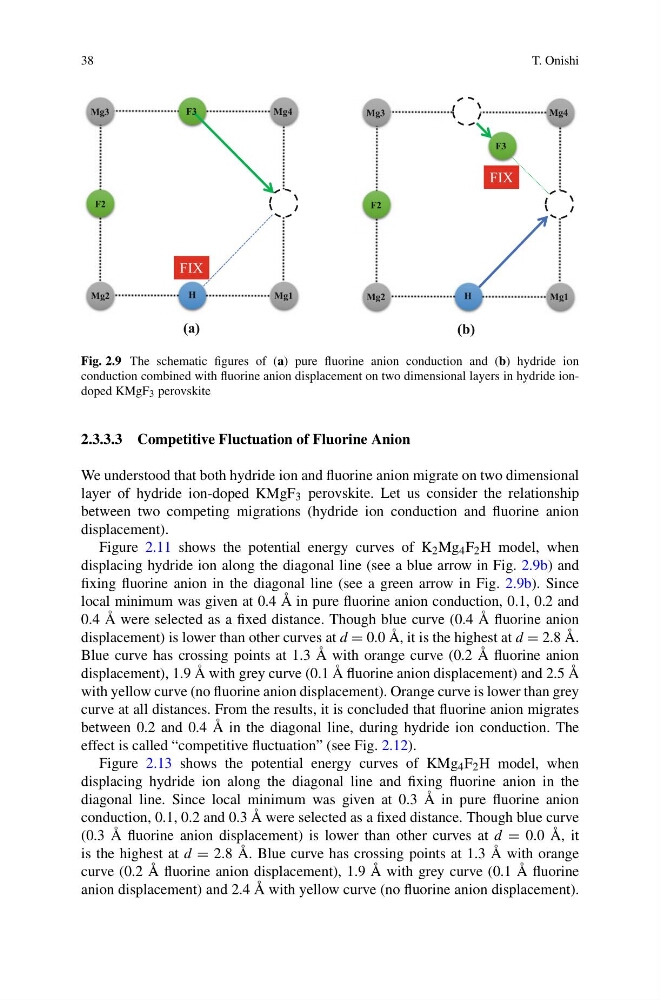
Fig. 2.9 The schematic figures of (a) pure fluorine anion conduction and (b) hydride ion
conduction combined with fluorine anion displacement on two dimensional layers in hydride iondoped KMgF 3 perovskite
2.3.3.3 Competitive Fluctuation of Fluorine Anion
We understood that both hydride ion and fluorine anion migrate on two dimensional
layer of hydride ion-doped KMgF 3 perovskite. Let us consider the relationship
between two competing migrations (hydride ion conduction and fluorine anion
displacement).
Figure 2.11 shows the potential energy curves of K 2 Mg 4 F 2 H model, when
displacing hydride ion along the diagonal line (see a blue arrow in Fig. 2.9b) and
fixing fluorine anion in the diagonal line (see a green arrow in Fig. 2.9b). Since
local minimum was given at 0.4 Å in pure fluorine anion conduction, 0.1, 0.2 and
0.4 Å were selected as a fixed distance. Though blue curve (0.4 Å fluorine anion
displacement) is lower than other curves at d = 0.0 Å, it is the highest at d = 2.8 Å.
Blue curve has crossing points at 1.3 Å with orange curve (0.2 Å fluorine anion
displacement), 1.9 Å with grey curve (0.1 Å fluorine anion displacement) and 2.5 Å
with yellow curve (no fluorine anion displacement). Orange curve is lower than grey
curve at all distances. From the results, it is concluded that fluorine anion migrates
between 0.2 and 0.4 Å in the diagonal line, during hydride ion conduction. The
effect is called “competitive fluctuation” (see Fig. 2.12).
Figure 2.13 shows the potential energy curves of KMg 4 F 2 H model, when
displacing hydride ion along the diagonal line and fixing fluorine anion in the
diagonal line. Since local minimum was given at 0.3 Å in pure fluorine anion
conduction, 0.1, 0.2 and 0.3 Å were selected as a fixed distance. Though blue curve
(0.3 Å fluorine anion displacement) is lower than other curves at d = 0.0 Å, it
is the highest at d = 2.8 Å. Blue curve has crossing points at 1.3 Å with orange
curve (0.2 Å fluorine anion displacement), 1.9 Å with grey curve (0.1 Å fluorine
anion displacement) and 2.4 Å with yellow curve (no fluorine anion displacement).
T. Onishi
(a)
FIX
F2
Mg3
H
Mg1
Mg2
Mg4
F3
(b)
FIX
F2
Mg3
H
Mg1
Mg2
Mg4
F3
Fig. 2.9 The schematic figures of (a) pure fluorine anion conduction and (b) hydride ion
conduction combined with fluorine anion displacement on two dimensional layers in hydride iondoped KMgF 3 perovskite
2.3.3.3 Competitive Fluctuation of Fluorine Anion
We understood that both hydride ion and fluorine anion migrate on two dimensional
layer of hydride ion-doped KMgF 3 perovskite. Let us consider the relationship
between two competing migrations (hydride ion conduction and fluorine anion
displacement).
Figure 2.11 shows the potential energy curves of K 2 Mg 4 F 2 H model, when
displacing hydride ion along the diagonal line (see a blue arrow in Fig. 2.9b) and
fixing fluorine anion in the diagonal line (see a green arrow in Fig. 2.9b). Since
local minimum was given at 0.4 Å in pure fluorine anion conduction, 0.1, 0.2 and
0.4 Å were selected as a fixed distance. Though blue curve (0.4 Å fluorine anion
displacement) is lower than other curves at d = 0.0 Å, it is the highest at d = 2.8 Å.
Blue curve has crossing points at 1.3 Å with orange curve (0.2 Å fluorine anion
displacement), 1.9 Å with grey curve (0.1 Å fluorine anion displacement) and 2.5 Å
with yellow curve (no fluorine anion displacement). Orange curve is lower than grey
curve at all distances. From the results, it is concluded that fluorine anion migrates
between 0.2 and 0.4 Å in the diagonal line, during hydride ion conduction. The
effect is called “competitive fluctuation” (see Fig. 2.12).
Figure 2.13 shows the potential energy curves of KMg 4 F 2 H model, when
displacing hydride ion along the diagonal line and fixing fluorine anion in the
diagonal line. Since local minimum was given at 0.3 Å in pure fluorine anion
conduction, 0.1, 0.2 and 0.3 Å were selected as a fixed distance. Though blue curve
(0.3 Å fluorine anion displacement) is lower than other curves at d = 0.0 Å, it
is the highest at d = 2.8 Å. Blue curve has crossing points at 1.3 Å with orange
curve (0.2 Å fluorine anion displacement), 1.9 Å with grey curve (0.1 Å fluorine
anion displacement) and 2.4 Å with yellow curve (no fluorine anion displacement).