

34
T. Onishi
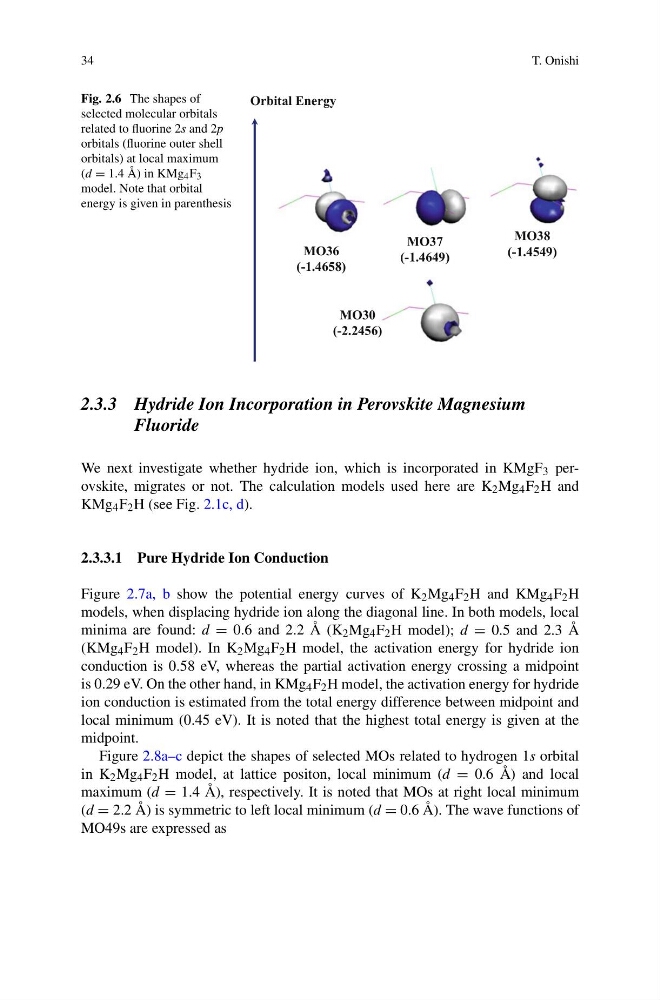
Fig. 2.6 The shapes of
selected molecular orbitals
related to fluorine 2s and 2p
orbitals (fluorine outer shell
orbitals) at local maximum
(d = 1.4 Å) in KMg 4 F 3
model. Note that orbital
energy is given in parenthesis
Orbital Energy
MO36
(-1.4658)
MO37
(-1.4649)
MO38
(-1.4549)
MO30
(-2.2456)
2.3.3 Hydride Ion Incorporation in Perovskite Magnesium
Fluoride
We next investigate whether hydride ion, which is incorporated in KMgF 3 perovskite, migrates or not. The calculation models used here are K 2 Mg 4 F 2 H and
KMg 4 F 2 H (see Fig. 2.1c, d).
2.3.3.1 Pure Hydride Ion Conduction
Figure 2.7a, b show the potential energy curves of K 2 Mg 4 F 2 H and KMg 4 F 2 H
models, when displacing hydride ion along the diagonal line. In both models, local
minima are found: d = 0.6 and 2.2 Å (K 2 Mg 4 F 2 H model); d = 0.5 and 2.3 Å
(KMg 4 F 2 H model). In K 2 Mg 4 F 2 H model, the activation energy for hydride ion
conduction is 0.58 eV, whereas the partial activation energy crossing a midpoint
is 0.29 eV. On the other hand, in KMg 4 F 2 H model, the activation energy for hydride
ion conduction is estimated from the total energy difference between midpoint and
local minimum (0.45 eV). It is noted that the highest total energy is given at the
midpoint.
Figure 2.8a–c depict the shapes of selected MOs related to hydrogen 1s orbital
in K 2 Mg 4 F 2 H model, at lattice positon, local minimum (d = 0.6 Å) and local
maximum (d = 1.4 Å), respectively. It is noted that MOs at right local minimum
(d = 2.2 Å) is symmetric to left local minimum (d = 0.6 Å). The wave functions of
MO49s are expressed as
T. Onishi
Fig. 2.6 The shapes of
selected molecular orbitals
related to fluorine 2s and 2p
orbitals (fluorine outer shell
orbitals) at local maximum
(d = 1.4 Å) in KMg 4 F 3
model. Note that orbital
energy is given in parenthesis
Orbital Energy
MO36
(-1.4658)
MO37
(-1.4649)
MO38
(-1.4549)
MO30
(-2.2456)
2.3.3 Hydride Ion Incorporation in Perovskite Magnesium
Fluoride
We next investigate whether hydride ion, which is incorporated in KMgF 3 perovskite, migrates or not. The calculation models used here are K 2 Mg 4 F 2 H and
KMg 4 F 2 H (see Fig. 2.1c, d).
2.3.3.1 Pure Hydride Ion Conduction
Figure 2.7a, b show the potential energy curves of K 2 Mg 4 F 2 H and KMg 4 F 2 H
models, when displacing hydride ion along the diagonal line. In both models, local
minima are found: d = 0.6 and 2.2 Å (K 2 Mg 4 F 2 H model); d = 0.5 and 2.3 Å
(KMg 4 F 2 H model). In K 2 Mg 4 F 2 H model, the activation energy for hydride ion
conduction is 0.58 eV, whereas the partial activation energy crossing a midpoint
is 0.29 eV. On the other hand, in KMg 4 F 2 H model, the activation energy for hydride
ion conduction is estimated from the total energy difference between midpoint and
local minimum (0.45 eV). It is noted that the highest total energy is given at the
midpoint.
Figure 2.8a–c depict the shapes of selected MOs related to hydrogen 1s orbital
in K 2 Mg 4 F 2 H model, at lattice positon, local minimum (d = 0.6 Å) and local
maximum (d = 1.4 Å), respectively. It is noted that MOs at right local minimum
(d = 2.2 Å) is symmetric to left local minimum (d = 0.6 Å). The wave functions of
MO49s are expressed as