

456
H. Kobayashi
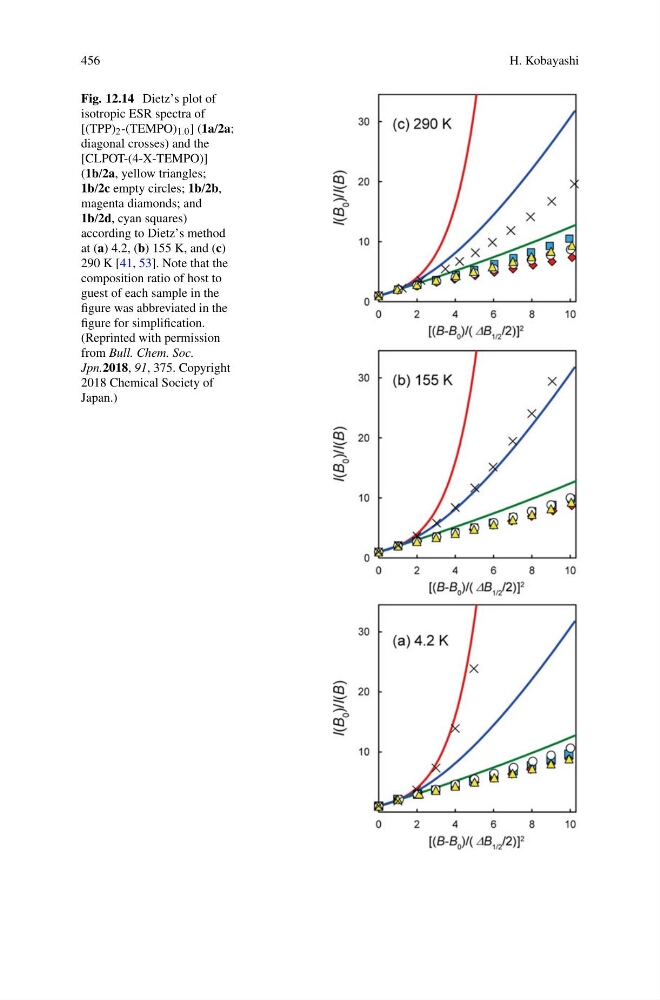
Fig. 12.14 Dietz’s plot of
isotropic ESR spectra of
[(TPP) 2 -(TEMPO) 1.0 ] (1a/2a;
diagonal crosses) and the
[CLPOT-(4-X-TEMPO)]
(1b/2a, yellow triangles;
1b/2c empty circles; 1b/2b,
magenta diamonds; and
1b/2d, cyan squares)
according to Dietz’s method
at (a) 4.2, (b) 155 K, and (c)
290 K [41, 53]. Note that the
composition ratio of host to
guest of each sample in the
figure was abbreviated in the
figure for simplification.
(Reprinted with permission
from Bull. Chem. Soc.
Jpn.2018, 91, 375. Copyright
2018 Chemical Society of
Japan.)
H. Kobayashi
Fig. 12.14 Dietz’s plot of
isotropic ESR spectra of
[(TPP) 2 -(TEMPO) 1.0 ] (1a/2a;
diagonal crosses) and the
[CLPOT-(4-X-TEMPO)]
(1b/2a, yellow triangles;
1b/2c empty circles; 1b/2b,
magenta diamonds; and
1b/2d, cyan squares)
according to Dietz’s method
at (a) 4.2, (b) 155 K, and (c)
290 K [41, 53]. Note that the
composition ratio of host to
guest of each sample in the
figure was abbreviated in the
figure for simplification.
(Reprinted with permission
from Bull. Chem. Soc.
Jpn.2018, 91, 375. Copyright
2018 Chemical Society of
Japan.)