

450
H. Kobayashi
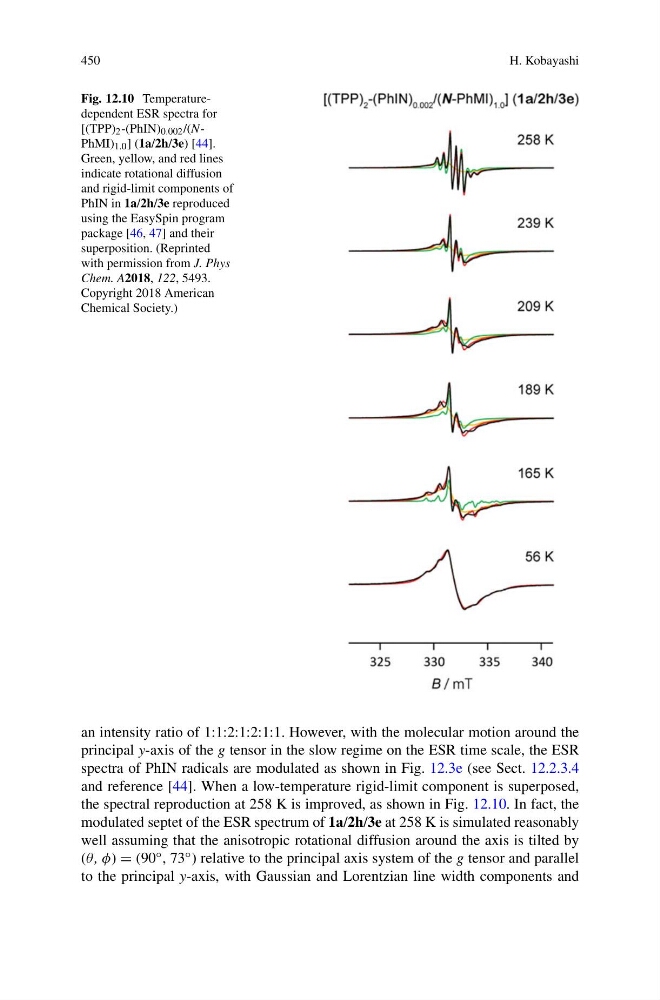
Fig. 12.10 Temperaturedependent ESR spectra for
[(TPP) 2 -(PhIN) 0.002 /(NPhMI) 1.0 ] (1a/2h/3e) [44].
Green, yellow, and red lines
indicate rotational diffusion
and rigid-limit components of
PhIN in 1a/2h/3e reproduced
using the EasySpin program
package [46, 47] and their
superposition. (Reprinted
with permission from J. Phys
Chem. A2018, 122, 5493.
Copyright 2018 American
Chemical Society.)
an intensity ratio of 1:1:2:1:2:1:1. However, with the molecular motion around the
principal y-axis of the g tensor in the slow regime on the ESR time scale, the ESR
spectra of PhIN radicals are modulated as shown in Fig. 12.3e (see Sect. 12.2.3.4
and reference [44]. When a low-temperature rigid-limit component is superposed,
the spectral reproduction at 258 K is improved, as shown in Fig. 12.10. In fact, the
modulated septet of the ESR spectrum of 1a/2h/3e at 258 K is simulated reasonably
well assuming that the anisotropic rotational diffusion around the axis is tilted by
(θ , φ) = (90 ◦ , 73 ◦ ) relative to the principal axis system of the g tensor and parallel
to the principal y-axis, with Gaussian and Lorentzian line width components and
H. Kobayashi
Fig. 12.10 Temperaturedependent ESR spectra for
[(TPP) 2 -(PhIN) 0.002 /(NPhMI) 1.0 ] (1a/2h/3e) [44].
Green, yellow, and red lines
indicate rotational diffusion
and rigid-limit components of
PhIN in 1a/2h/3e reproduced
using the EasySpin program
package [46, 47] and their
superposition. (Reprinted
with permission from J. Phys
Chem. A2018, 122, 5493.
Copyright 2018 American
Chemical Society.)
an intensity ratio of 1:1:2:1:2:1:1. However, with the molecular motion around the
principal y-axis of the g tensor in the slow regime on the ESR time scale, the ESR
spectra of PhIN radicals are modulated as shown in Fig. 12.3e (see Sect. 12.2.3.4
and reference [44]. When a low-temperature rigid-limit component is superposed,
the spectral reproduction at 258 K is improved, as shown in Fig. 12.10. In fact, the
modulated septet of the ESR spectrum of 1a/2h/3e at 258 K is simulated reasonably
well assuming that the anisotropic rotational diffusion around the axis is tilted by
(θ , φ) = (90 ◦ , 73 ◦ ) relative to the principal axis system of the g tensor and parallel
to the principal y-axis, with Gaussian and Lorentzian line width components and