

412
T. Okura and K. Yamashita
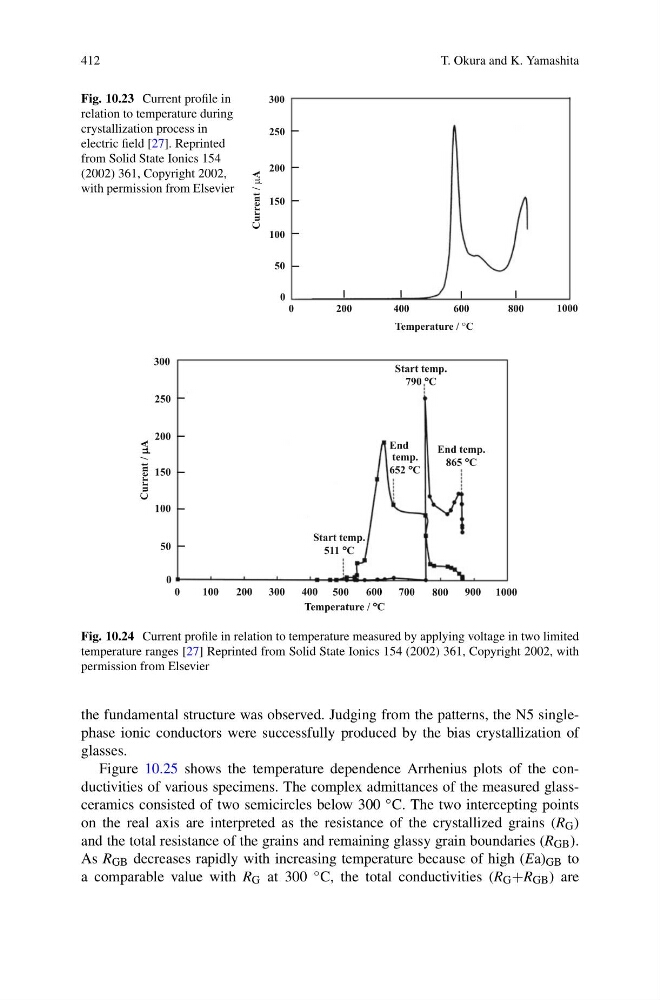
Fig. 10.23 Current profile in
relation to temperature during
crystallization process in
electric field [27]. Reprinted
from Solid State Ionics 154
(2002) 361, Copyright 2002,
with permission from Elsevier
0
200
400
600
800
1000
300
250
200
150
100
50
0
Temperature / C
Current /
μA
0
200
400
600
800
1000
300
250
200
150
100
50
0
Temperature / ° °C
Current /
μA
500
100
300
700
900
Start temp.
511 °C
End
temp.
652 °C
Start temp.
790 °C
End temp.
865 °C
Fig. 10.24 Current profile in relation to temperature measured by applying voltage in two limited
temperature ranges [27] Reprinted from Solid State Ionics 154 (2002) 361, Copyright 2002, with
permission from Elsevier
the fundamental structure was observed. Judging from the patterns, the N5 singlephase ionic conductors were successfully produced by the bias crystallization of
glasses.
Figure 10.25 shows the temperature dependence Arrhenius plots of the conductivities of various specimens. The complex admittances of the measured glassceramics consisted of two semicircles below 300 ◦ C. The two intercepting points
on the real axis are interpreted as the resistance of the crystallized grains (R G )
and the total resistance of the grains and remaining glassy grain boundaries (R GB ).
As R GB decreases rapidly with increasing temperature because of high (Ea) GB to
a comparable value with R G at 300 ◦ C, the total conductivities (R G +R GB ) are
T. Okura and K. Yamashita
Fig. 10.23 Current profile in
relation to temperature during
crystallization process in
electric field [27]. Reprinted
from Solid State Ionics 154
(2002) 361, Copyright 2002,
with permission from Elsevier
0
200
400
600
800
1000
300
250
200
150
100
50
0
Temperature / C
Current /
μA
0
200
400
600
800
1000
300
250
200
150
100
50
0
Temperature / ° °C
Current /
μA
500
100
300
700
900
Start temp.
511 °C
End
temp.
652 °C
Start temp.
790 °C
End temp.
865 °C
Fig. 10.24 Current profile in relation to temperature measured by applying voltage in two limited
temperature ranges [27] Reprinted from Solid State Ionics 154 (2002) 361, Copyright 2002, with
permission from Elsevier
the fundamental structure was observed. Judging from the patterns, the N5 singlephase ionic conductors were successfully produced by the bias crystallization of
glasses.
Figure 10.25 shows the temperature dependence Arrhenius plots of the conductivities of various specimens. The complex admittances of the measured glassceramics consisted of two semicircles below 300 ◦ C. The two intercepting points
on the real axis are interpreted as the resistance of the crystallized grains (R G )
and the total resistance of the grains and remaining glassy grain boundaries (R GB ).
As R GB decreases rapidly with increasing temperature because of high (Ea) GB to
a comparable value with R G at 300 ◦ C, the total conductivities (R G +R GB ) are