

410
T. Okura and K. Yamashita
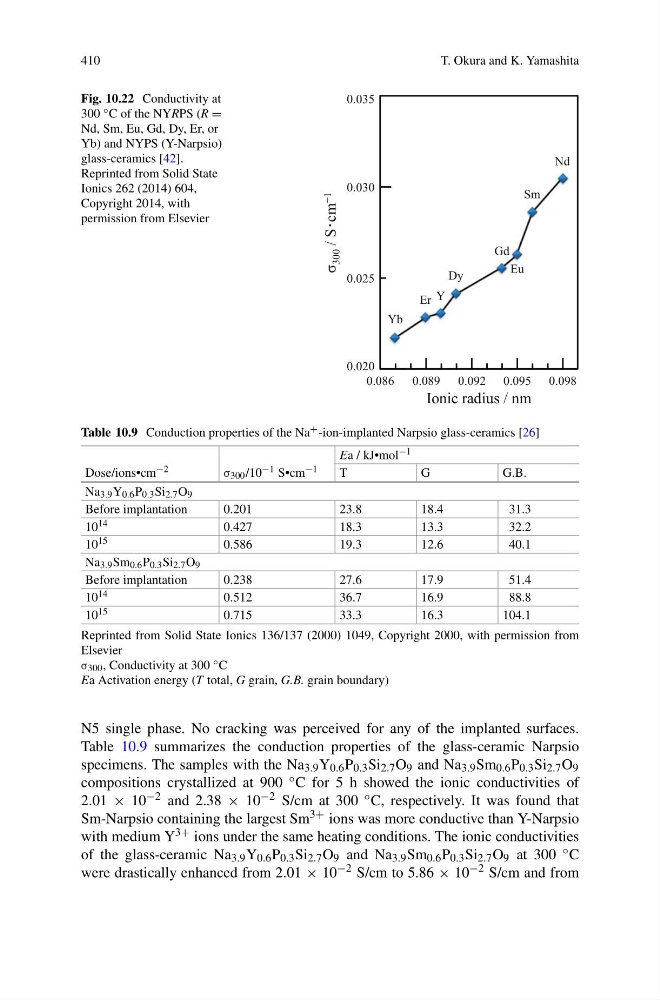
Fig. 10.22 Conductivity at
300 ◦ C of the NYRPS (R =
Nd, Sm, Eu, Gd, Dy, Er, or
Yb) and NYPS (Y-Narpsio)
glass-ceramics [42].
Reprinted from Solid State
Ionics 262 (2014) 604,
Copyright 2014, with
permission from Elsevier
Eu
Ionic radius / nm
0.086 0.089 0.092 0.095 0.098
0.035
0.025
0.020
Sm
Gd
Y
Er
Yb
Dy
Nd
0.030
σ
300 / S䡡cm −1
Table 10.9 Conduction properties of the Na + -ion-implanted Narpsio glass-ceramics [26]
Ea / kJ•mol −1
Dose/ions•cm −2
σ 300 /10 −1 S•cm −1
T
G
G.B.
Na 3.9 Y 0.6 P 0.3 Si 2.7 O 9
Before implantation
0.201
23.8
18.4
31.3
10 14
0.427
18.3
13.3
32.2
10 15
0.586
19.3
12.6
40.1
Na 3.9 Sm 0.6 P 0.3 Si 2.7 O 9
Before implantation
0.238
27.6
17.9
51.4
10 14
0.512
36.7
16.9
88.8
10 15
0.715
33.3
16.3
104.1
Reprinted from Solid State Ionics 136/137 (2000) 1049, Copyright 2000, with permission from
Elsevier
σ 300 , Conductivity at 300 ◦ C
Ea Activation energy (T total, G grain, G.B. grain boundary)
N5 single phase. No cracking was perceived for any of the implanted surfaces.
Table 10.9 summarizes the conduction properties of the glass-ceramic Narpsio
specimens. The samples with the Na 3.9 Y 0.6 P 0.3 Si 2.7 O 9 and Na 3.9 Sm 0.6 P 0.3 Si 2.7 O 9
compositions crystallized at 900 ◦ C for 5 h showed the ionic conductivities of
2.01 × 10 −2 and 2.38 × 10 −2 S/cm at 300 ◦ C, respectively. It was found that
Sm-Narpsio containing the largest Sm 3+ ions was more conductive than Y-Narpsio
with medium Y 3+ ions under the same heating conditions. The ionic conductivities
of the glass-ceramic Na 3.9 Y 0.6 P 0.3 Si 2.7 O 9 and Na 3.9 Sm 0.6 P 0.3 Si 2.7 O 9 at 300 ◦ C
were drastically enhanced from 2.01 × 10 −2 S/cm to 5.86 × 10 −2 S/cm and from
T. Okura and K. Yamashita
Fig. 10.22 Conductivity at
300 ◦ C of the NYRPS (R =
Nd, Sm, Eu, Gd, Dy, Er, or
Yb) and NYPS (Y-Narpsio)
glass-ceramics [42].
Reprinted from Solid State
Ionics 262 (2014) 604,
Copyright 2014, with
permission from Elsevier
Eu
Ionic radius / nm
0.086 0.089 0.092 0.095 0.098
0.035
0.025
0.020
Sm
Gd
Y
Er
Yb
Dy
Nd
0.030
σ
300 / S䡡cm −1
Table 10.9 Conduction properties of the Na + -ion-implanted Narpsio glass-ceramics [26]
Ea / kJ•mol −1
Dose/ions•cm −2
σ 300 /10 −1 S•cm −1
T
G
G.B.
Na 3.9 Y 0.6 P 0.3 Si 2.7 O 9
Before implantation
0.201
23.8
18.4
31.3
10 14
0.427
18.3
13.3
32.2
10 15
0.586
19.3
12.6
40.1
Na 3.9 Sm 0.6 P 0.3 Si 2.7 O 9
Before implantation
0.238
27.6
17.9
51.4
10 14
0.512
36.7
16.9
88.8
10 15
0.715
33.3
16.3
104.1
Reprinted from Solid State Ionics 136/137 (2000) 1049, Copyright 2000, with permission from
Elsevier
σ 300 , Conductivity at 300 ◦ C
Ea Activation energy (T total, G grain, G.B. grain boundary)
N5 single phase. No cracking was perceived for any of the implanted surfaces.
Table 10.9 summarizes the conduction properties of the glass-ceramic Narpsio
specimens. The samples with the Na 3.9 Y 0.6 P 0.3 Si 2.7 O 9 and Na 3.9 Sm 0.6 P 0.3 Si 2.7 O 9
compositions crystallized at 900 ◦ C for 5 h showed the ionic conductivities of
2.01 × 10 −2 and 2.38 × 10 −2 S/cm at 300 ◦ C, respectively. It was found that
Sm-Narpsio containing the largest Sm 3+ ions was more conductive than Y-Narpsio
with medium Y 3+ ions under the same heating conditions. The ionic conductivities
of the glass-ceramic Na 3.9 Y 0.6 P 0.3 Si 2.7 O 9 and Na 3.9 Sm 0.6 P 0.3 Si 2.7 O 9 at 300 ◦ C
were drastically enhanced from 2.01 × 10 −2 S/cm to 5.86 × 10 −2 S/cm and from