

162
S. Taioli
-4
-3
-2
-1
0
1
2
3
4
X
M
Energy [eV]
0
2
4
6
8
10
12
-4 -3 -2 -1
0
1
2
3
4
DOS
Energy [eV]
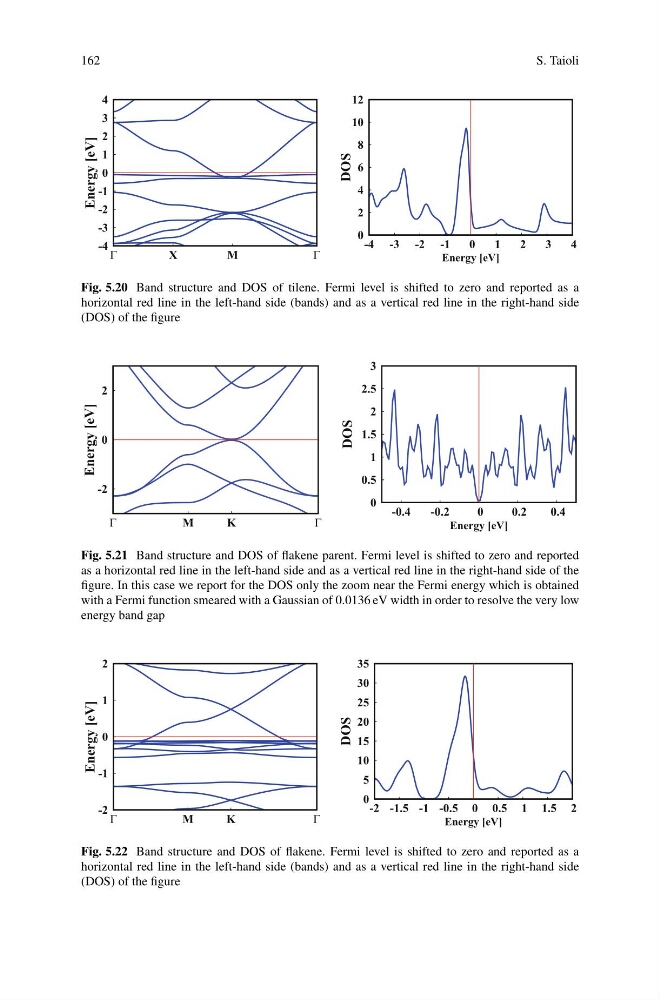
Fig. 5.20 Band structure and DOS of tilene. Fermi level is shifted to zero and reported as a
horizontal red line in the left-hand side (bands) and as a vertical red line in the right-hand side
(DOS) of the figure
-2
0
2
M
K
Energy [eV]
0
0.5
1
1.5
2
2.5
3
-0.4
-0.2
0
0.2
0.4
DOS
Energy [eV]
Fig. 5.21 Band structure and DOS of flakene parent. Fermi level is shifted to zero and reported
as a horizontal red line in the left-hand side and as a vertical red line in the right-hand side of the
figure. In this case we report for the DOS only the zoom near the Fermi energy which is obtained
with a Fermi function smeared with a Gaussian of 0.0136 eV width in order to resolve the very low
energy band gap
-2
-1
0
1
2
M
K
Energy [eV]
0
5
10
15
20
25
30
35
-2 -1.5 -1 -0.5 0 0.5 1 1.5 2
DOS
Energy [eV]
Fig. 5.22 Band structure and DOS of flakene. Fermi level is shifted to zero and reported as a
horizontal red line in the left-hand side (bands) and as a vertical red line in the right-hand side
(DOS) of the figure
S. Taioli
-4
-3
-2
-1
0
1
2
3
4
X
M
Energy [eV]
0
2
4
6
8
10
12
-4 -3 -2 -1
0
1
2
3
4
DOS
Energy [eV]
Fig. 5.20 Band structure and DOS of tilene. Fermi level is shifted to zero and reported as a
horizontal red line in the left-hand side (bands) and as a vertical red line in the right-hand side
(DOS) of the figure
-2
0
2
M
K
Energy [eV]
0
0.5
1
1.5
2
2.5
3
-0.4
-0.2
0
0.2
0.4
DOS
Energy [eV]
Fig. 5.21 Band structure and DOS of flakene parent. Fermi level is shifted to zero and reported
as a horizontal red line in the left-hand side and as a vertical red line in the right-hand side of the
figure. In this case we report for the DOS only the zoom near the Fermi energy which is obtained
with a Fermi function smeared with a Gaussian of 0.0136 eV width in order to resolve the very low
energy band gap
-2
-1
0
1
2
M
K
Energy [eV]
0
5
10
15
20
25
30
35
-2 -1.5 -1 -0.5 0 0.5 1 1.5 2
DOS
Energy [eV]
Fig. 5.22 Band structure and DOS of flakene. Fermi level is shifted to zero and reported as a
horizontal red line in the left-hand side (bands) and as a vertical red line in the right-hand side
(DOS) of the figure