

4 Nanoscale First-Principles Electronic Structure Simulations of Materials. . .
111
Table 4.5 Calculated nearest-neighbor transfer integrals for the HOMO and those for the LUMO
of the tetracene crystal obtained with the maximally localized Wannier functions [14, 15] based
on the DFT-PBE orbitals. t c1 and t c2 correspond to the transfer integrals along the shortest unit
cell vector, t a1 and t a2 to those along the second shortest unit cell vector, and t 1 and t 2 to those
between the two nonequivalent tetracene molecules as depicted in Figs. 4.7 and 4.8 (t b1 and t b2
along the longest cell vector are found to be essentially zero). W TB
H (W TB
L ) and W PBE
H
(W PBE
L )
denote the HOMO (LUMO)-derived band width within the tight-binding approximation and the
first-principles calculation with DFT-PBE, respectively. I and II denote the structures obtained
by the X-ray diffraction experiment in Refs. [45] and [50], respectively, and their internal atomic
coordinates were relaxed with their lattice constants fixed. Structure III denotes the one obtained by
full optimization of the cell and internal degrees of freedom, corresponding to the crystal geometry
displayed in Table 4.1. Unit is meV. (Reprinted from [13], with the permission of AIP Publishing)
Structure
I
II
III
HOMO
t c1
12.39
11.37
12.15
t c2
−4.72
−6.95
−6.48
t a1
−2.74
−4.33
−5.19
t a2
−2.23
−3.08
−3.22
t 1
16.56
20.45
22.79
t 2
−60.43
−66.54
−78.39
W TB
H
313.35
355.34
411.43
W PBE
H
322.17
370.68
417.33
LUMO
t c1
−31.01
−31.10
−33.04
t c2
−11.13
−10.76
−12.10
t a1
−1.55
−1.74
−2.09
t a2
−3.43
−4.09
−4.74
t 1
68.44
73.62
81.07
t 2
−57.38
−67.96
−78.02
W TB
L
510.78
570.12
639.72
W PBE
L
505.09
563.99
629.19
Energy (eV)
X
YL
ZN
k
Struct. II
Z N
Struct. I
k
X
YL
Z N
Struct. III
k
-1.0
-0.5
0.0
0.5
1.0
1.5
2.0
HOMO
LUMO
X
YL
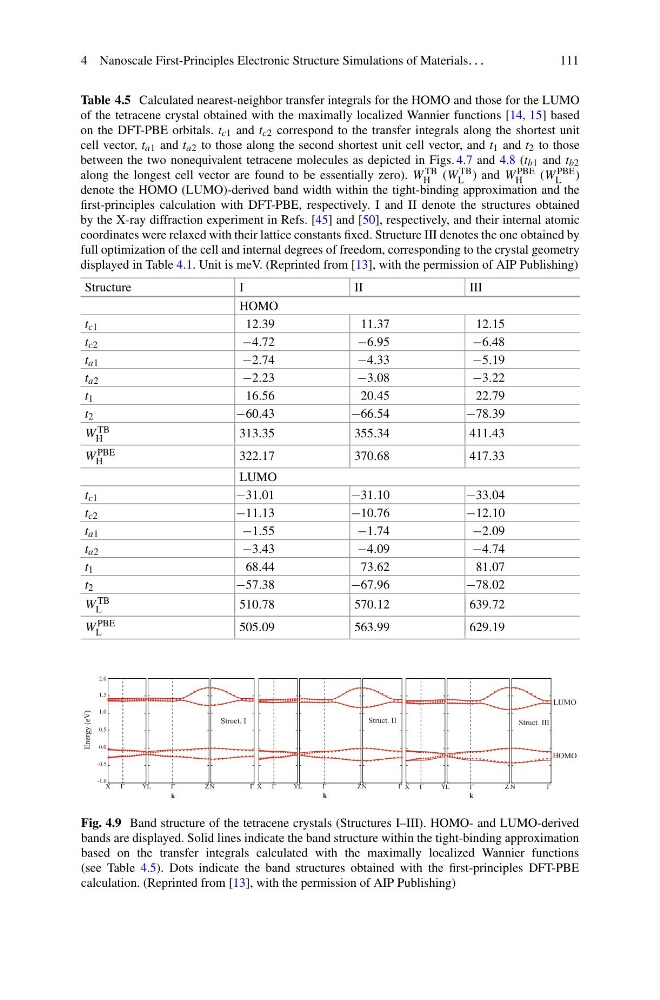
Fig. 4.9 Band structure of the tetracene crystals (Structures I–III). HOMO- and LUMO-derived
bands are displayed. Solid lines indicate the band structure within the tight-binding approximation
based on the transfer integrals calculated with the maximally localized Wannier functions
(see Table 4.5). Dots indicate the band structures obtained with the first-principles DFT-PBE
calculation. (Reprinted from [13], with the permission of AIP Publishing)
111
Table 4.5 Calculated nearest-neighbor transfer integrals for the HOMO and those for the LUMO
of the tetracene crystal obtained with the maximally localized Wannier functions [14, 15] based
on the DFT-PBE orbitals. t c1 and t c2 correspond to the transfer integrals along the shortest unit
cell vector, t a1 and t a2 to those along the second shortest unit cell vector, and t 1 and t 2 to those
between the two nonequivalent tetracene molecules as depicted in Figs. 4.7 and 4.8 (t b1 and t b2
along the longest cell vector are found to be essentially zero). W TB
H (W TB
L ) and W PBE
H
(W PBE
L )
denote the HOMO (LUMO)-derived band width within the tight-binding approximation and the
first-principles calculation with DFT-PBE, respectively. I and II denote the structures obtained
by the X-ray diffraction experiment in Refs. [45] and [50], respectively, and their internal atomic
coordinates were relaxed with their lattice constants fixed. Structure III denotes the one obtained by
full optimization of the cell and internal degrees of freedom, corresponding to the crystal geometry
displayed in Table 4.1. Unit is meV. (Reprinted from [13], with the permission of AIP Publishing)
Structure
I
II
III
HOMO
t c1
12.39
11.37
12.15
t c2
−4.72
−6.95
−6.48
t a1
−2.74
−4.33
−5.19
t a2
−2.23
−3.08
−3.22
t 1
16.56
20.45
22.79
t 2
−60.43
−66.54
−78.39
W TB
H
313.35
355.34
411.43
W PBE
H
322.17
370.68
417.33
LUMO
t c1
−31.01
−31.10
−33.04
t c2
−11.13
−10.76
−12.10
t a1
−1.55
−1.74
−2.09
t a2
−3.43
−4.09
−4.74
t 1
68.44
73.62
81.07
t 2
−57.38
−67.96
−78.02
W TB
L
510.78
570.12
639.72
W PBE
L
505.09
563.99
629.19
Energy (eV)
X
YL
ZN
k
Struct. II
Z N
Struct. I
k
X
YL
Z N
Struct. III
k
-1.0
-0.5
0.0
0.5
1.0
1.5
2.0
HOMO
LUMO
X
YL
Fig. 4.9 Band structure of the tetracene crystals (Structures I–III). HOMO- and LUMO-derived
bands are displayed. Solid lines indicate the band structure within the tight-binding approximation
based on the transfer integrals calculated with the maximally localized Wannier functions
(see Table 4.5). Dots indicate the band structures obtained with the first-principles DFT-PBE
calculation. (Reprinted from [13], with the permission of AIP Publishing)