

4 Nanoscale First-Principles Electronic Structure Simulations of Materials. . .
107
4.2.1.3 Effects of the Crystal Geometry and the Molecular Configuration
Here, we investigated the impact of the different crystal structures on the electronic
structure. For tetracene, theoretical DOS was obtained for the three crystal structures
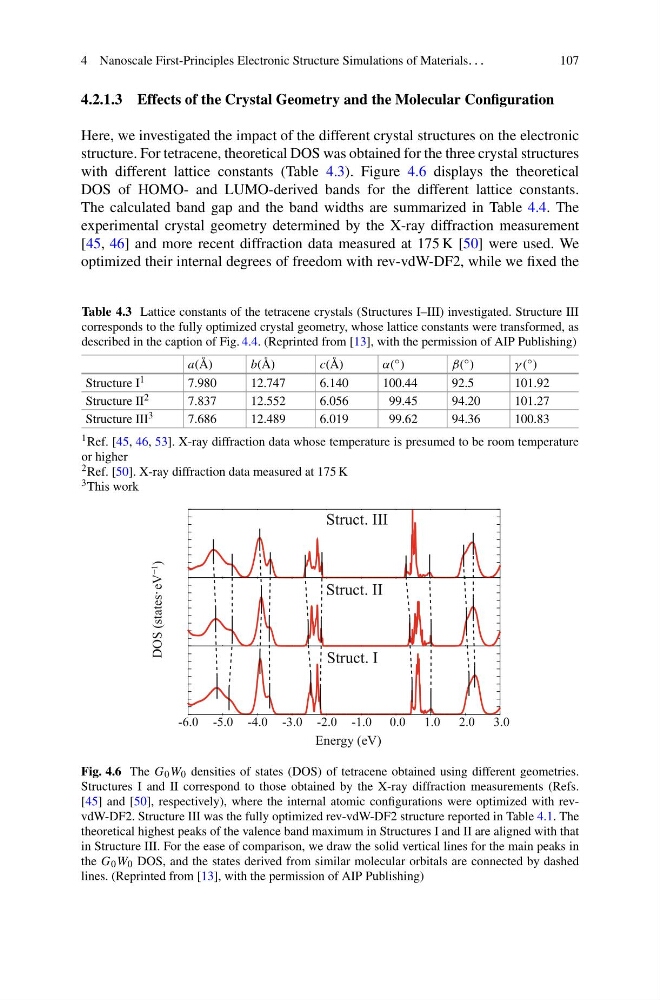
with different lattice constants (Table 4.3). Figure 4.6 displays the theoretical
DOS of HOMO- and LUMO-derived bands for the different lattice constants.
The calculated band gap and the band widths are summarized in Table 4.4. The
experimental crystal geometry determined by the X-ray diffraction measurement
[45, 46] and more recent diffraction data measured at 175 K [50] were used. We
optimized their internal degrees of freedom with rev-vdW-DF2, while we fixed the
Table 4.3 Lattice constants of the tetracene crystals (Structures I–III) investigated. Structure III
corresponds to the fully optimized crystal geometry, whose lattice constants were transformed, as
described in the caption of Fig. 4.4. (Reprinted from [13], with the permission of AIP Publishing)
a(Å)
b(Å)
c(Å)
α( ◦ )
β( ◦ )
γ ( ◦ )
Structure I 1
7.980
12.747
6.140
100.44
92.5
101.92
Structure II 2
7.837
12.552
6.056
99.45
94.20
101.27
Structure III 3
7.686
12.489
6.019
99.62
94.36
100.83
1 Ref. [45, 46, 53]. X-ray diffraction data whose temperature is presumed to be room temperature
or higher
2 Ref. [50]. X-ray diffraction data measured at 175 K
3 This work
Struct. III
Struct. II
Energy (eV)
-6.0 -5.0 -4.0 -3.0 -2.0 -1.0 0.0 1.0 2.0 3.0
Struct. I
DOS (states·eV
−1
)
Fig. 4.6 The G 0 W 0 densities of states (DOS) of tetracene obtained using different geometries.
Structures I and II correspond to those obtained by the X-ray diffraction measurements (Refs.
[45] and [50], respectively), where the internal atomic configurations were optimized with revvdW-DF2. Structure III was the fully optimized rev-vdW-DF2 structure reported in Table 4.1. The
theoretical highest peaks of the valence band maximum in Structures I and II are aligned with that
in Structure III. For the ease of comparison, we draw the solid vertical lines for the main peaks in
the G 0 W 0 DOS, and the states derived from similar molecular orbitals are connected by dashed
lines. (Reprinted from [13], with the permission of AIP Publishing)
107
4.2.1.3 Effects of the Crystal Geometry and the Molecular Configuration
Here, we investigated the impact of the different crystal structures on the electronic
structure. For tetracene, theoretical DOS was obtained for the three crystal structures
with different lattice constants (Table 4.3). Figure 4.6 displays the theoretical
DOS of HOMO- and LUMO-derived bands for the different lattice constants.
The calculated band gap and the band widths are summarized in Table 4.4. The
experimental crystal geometry determined by the X-ray diffraction measurement
[45, 46] and more recent diffraction data measured at 175 K [50] were used. We
optimized their internal degrees of freedom with rev-vdW-DF2, while we fixed the
Table 4.3 Lattice constants of the tetracene crystals (Structures I–III) investigated. Structure III
corresponds to the fully optimized crystal geometry, whose lattice constants were transformed, as
described in the caption of Fig. 4.4. (Reprinted from [13], with the permission of AIP Publishing)
a(Å)
b(Å)
c(Å)
α( ◦ )
β( ◦ )
γ ( ◦ )
Structure I 1
7.980
12.747
6.140
100.44
92.5
101.92
Structure II 2
7.837
12.552
6.056
99.45
94.20
101.27
Structure III 3
7.686
12.489
6.019
99.62
94.36
100.83
1 Ref. [45, 46, 53]. X-ray diffraction data whose temperature is presumed to be room temperature
or higher
2 Ref. [50]. X-ray diffraction data measured at 175 K
3 This work
Struct. III
Struct. II
Energy (eV)
-6.0 -5.0 -4.0 -3.0 -2.0 -1.0 0.0 1.0 2.0 3.0
Struct. I
DOS (states·eV
−1
)
Fig. 4.6 The G 0 W 0 densities of states (DOS) of tetracene obtained using different geometries.
Structures I and II correspond to those obtained by the X-ray diffraction measurements (Refs.
[45] and [50], respectively), where the internal atomic configurations were optimized with revvdW-DF2. Structure III was the fully optimized rev-vdW-DF2 structure reported in Table 4.1. The
theoretical highest peaks of the valence band maximum in Structures I and II are aligned with that
in Structure III. For the ease of comparison, we draw the solid vertical lines for the main peaks in
the G 0 W 0 DOS, and the states derived from similar molecular orbitals are connected by dashed
lines. (Reprinted from [13], with the permission of AIP Publishing)