

102
S. Yanagisawa and I. Hamada
-2.0
0.0
2.0
4.0
6.0
Y
H C
E M 1 A
X
Z
Energy (eV)
(a)
H
H−1
H−2
L
L+1
(b)
H
H−1
H−2
L
L+1
Exp.
DOS (states·eV −1
)
Energy (eV)
0.0
2.0
4.0
6.0
8.0
10.0
-6.0 -5.0 -4.0 -3.0 -2.0 -1.0 0.0 1.0 2.0
DOS (arb. unit)
W H
W L
E g
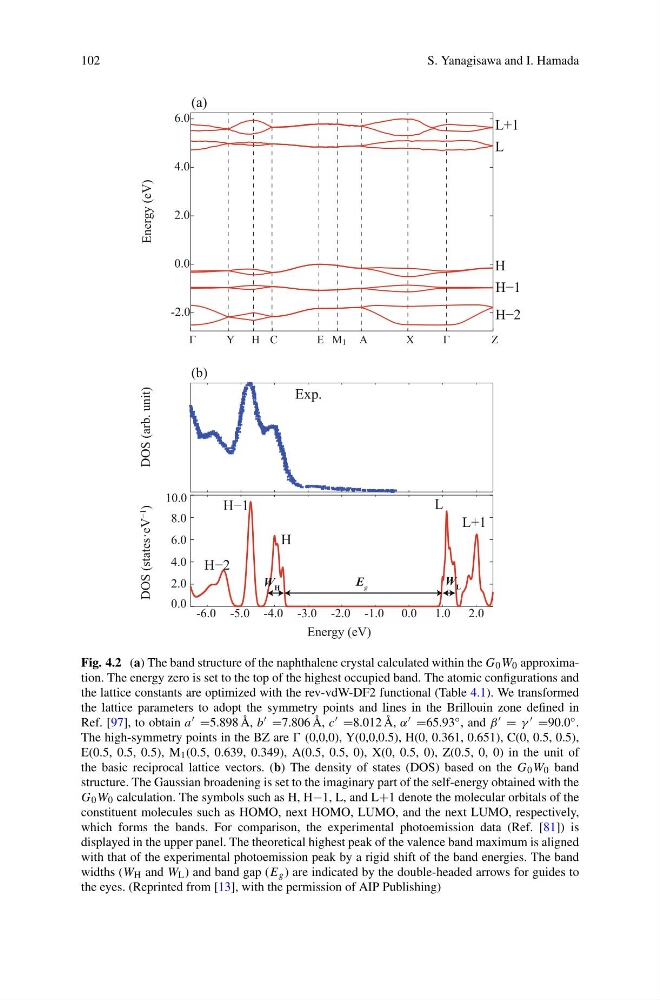
Fig. 4.2 (a) The band structure of the naphthalene crystal calculated within the G 0 W 0 approximation. The energy zero is set to the top of the highest occupied band. The atomic configurations and
the lattice constants are optimized with the rev-vdW-DF2 functional (Table 4.1). We transformed
the lattice parameters to adopt the symmetry points and lines in the Brillouin zone defined in
Ref. [97], to obtain a =5.898 Å, b =7.806 Å, c =8.012 Å, α =65.93 ◦ , and β = γ =90.0 ◦ .
The high-symmetry points in the BZ are (0,0,0), Y(0,0,0.5), H(0, 0.361, 0.651), C(0, 0.5, 0.5),
E(0.5, 0.5, 0.5), M 1 (0.5, 0.639, 0.349), A(0.5, 0.5, 0), X(0, 0.5, 0), Z(0.5, 0, 0) in the unit of
the basic reciprocal lattice vectors. (b) The density of states (DOS) based on the G 0 W 0 band
structure. The Gaussian broadening is set to the imaginary part of the self-energy obtained with the
G 0 W 0 calculation. The symbols such as H, H−1, L, and L+1 denote the molecular orbitals of the
constituent molecules such as HOMO, next HOMO, LUMO, and the next LUMO, respectively,
which forms the bands. For comparison, the experimental photoemission data (Ref. [81]) is
displayed in the upper panel. The theoretical highest peak of the valence band maximum is aligned
with that of the experimental photoemission peak by a rigid shift of the band energies. The band
widths (W H and W L ) and band gap (E g ) are indicated by the double-headed arrows for guides to
the eyes. (Reprinted from [13], with the permission of AIP Publishing)
S. Yanagisawa and I. Hamada
-2.0
0.0
2.0
4.0
6.0
Y
H C
E M 1 A
X
Z
Energy (eV)
(a)
H
H−1
H−2
L
L+1
(b)
H
H−1
H−2
L
L+1
Exp.
DOS (states·eV −1
)
Energy (eV)
0.0
2.0
4.0
6.0
8.0
10.0
-6.0 -5.0 -4.0 -3.0 -2.0 -1.0 0.0 1.0 2.0
DOS (arb. unit)
W H
W L
E g
Fig. 4.2 (a) The band structure of the naphthalene crystal calculated within the G 0 W 0 approximation. The energy zero is set to the top of the highest occupied band. The atomic configurations and
the lattice constants are optimized with the rev-vdW-DF2 functional (Table 4.1). We transformed
the lattice parameters to adopt the symmetry points and lines in the Brillouin zone defined in
Ref. [97], to obtain a =5.898 Å, b =7.806 Å, c =8.012 Å, α =65.93 ◦ , and β = γ =90.0 ◦ .
The high-symmetry points in the BZ are (0,0,0), Y(0,0,0.5), H(0, 0.361, 0.651), C(0, 0.5, 0.5),
E(0.5, 0.5, 0.5), M 1 (0.5, 0.639, 0.349), A(0.5, 0.5, 0), X(0, 0.5, 0), Z(0.5, 0, 0) in the unit of
the basic reciprocal lattice vectors. (b) The density of states (DOS) based on the G 0 W 0 band
structure. The Gaussian broadening is set to the imaginary part of the self-energy obtained with the
G 0 W 0 calculation. The symbols such as H, H−1, L, and L+1 denote the molecular orbitals of the
constituent molecules such as HOMO, next HOMO, LUMO, and the next LUMO, respectively,
which forms the bands. For comparison, the experimental photoemission data (Ref. [81]) is
displayed in the upper panel. The theoretical highest peak of the valence band maximum is aligned
with that of the experimental photoemission peak by a rigid shift of the band energies. The band
widths (W H and W L ) and band gap (E g ) are indicated by the double-headed arrows for guides to
the eyes. (Reprinted from [13], with the permission of AIP Publishing)