

2.1.3 NIR-II Imaging Fluorophores
The generation of new fluorophores and the development of fluorescent labeling
technology provide specific and efficient contrast for FMI and greatly improve the
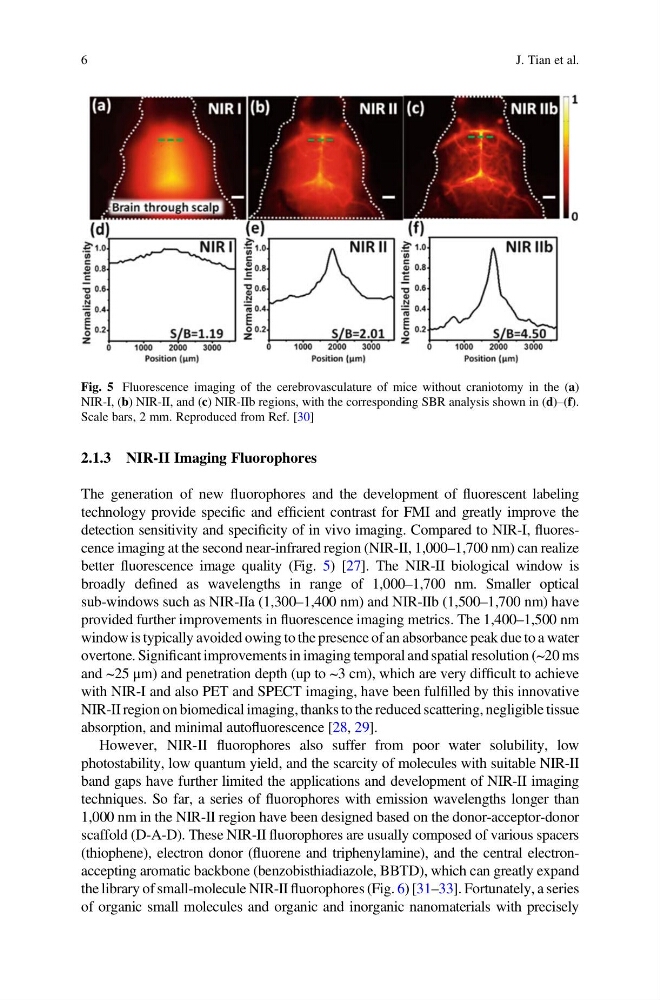
detection sensitivity and specificity of in vivo imaging. Compared to NIR-I, fluorescence imaging at the second near-infrared region (NIR-II, 1,000–1,700 nm) can realize
better fluorescence image quality (Fig. 5) [27]. The NIR-II biological window is
broadly defined as wavelengths in range of 1,000–1,700 nm. Smaller optical
sub-windows such as NIR-IIa (1,300–1,400 nm) and NIR-IIb (1,500–1,700 nm) have
provided further improvements in fluorescence imaging metrics. The 1,400–1,500 nm
window is typically avoided owing to the presence of an absorbance peak due to a water
overtone. Significant improvements in imaging temporal and spatial resolution (~20 ms
and ~25 μm) and penetration depth (up to ~3 cm), which are very difficult to achieve
with NIR-I and also PET and SPECT imaging, have been fulfilled by this innovative
NIR-II region on biomedical imaging, thanks to the reduced scattering, negligible tissue
absorption, and minimal autofluorescence [28, 29].
However, NIR-II fluorophores also suffer from poor water solubility, low
photostability, low quantum yield, and the scarcity of molecules with suitable NIR-II
band gaps have further limited the applications and development of NIR-II imaging
techniques. So far, a series of fluorophores with emission wavelengths longer than
1,000 nm in the NIR-II region have been designed based on the donor-acceptor-donor
scaffold (D-A-D). These NIR-II fluorophores are usually composed of various spacers
(thiophene), electron donor (fluorene and triphenylamine), and the central electronaccepting aromatic backbone (benzobisthiadiazole, BBTD), which can greatly expand
the library of small-molecule NIR-II fluorophores (Fig. 6) [31–33]. Fortunately, a series
of organic small molecules and organic and inorganic nanomaterials with precisely
Fig. 5 Fluorescence imaging of the cerebrovasculature of mice without craniotomy in the (a)
NIR-I, (b) NIR-II, and (c) NIR-IIb regions, with the corresponding SBR analysis shown in (d)–(f).
Scale bars, 2 mm. Reproduced from Ref. [30]
6
J. Tian et al.
The generation of new fluorophores and the development of fluorescent labeling
technology provide specific and efficient contrast for FMI and greatly improve the
detection sensitivity and specificity of in vivo imaging. Compared to NIR-I, fluorescence imaging at the second near-infrared region (NIR-II, 1,000–1,700 nm) can realize
better fluorescence image quality (Fig. 5) [27]. The NIR-II biological window is
broadly defined as wavelengths in range of 1,000–1,700 nm. Smaller optical
sub-windows such as NIR-IIa (1,300–1,400 nm) and NIR-IIb (1,500–1,700 nm) have
provided further improvements in fluorescence imaging metrics. The 1,400–1,500 nm
window is typically avoided owing to the presence of an absorbance peak due to a water
overtone. Significant improvements in imaging temporal and spatial resolution (~20 ms
and ~25 μm) and penetration depth (up to ~3 cm), which are very difficult to achieve
with NIR-I and also PET and SPECT imaging, have been fulfilled by this innovative
NIR-II region on biomedical imaging, thanks to the reduced scattering, negligible tissue
absorption, and minimal autofluorescence [28, 29].
However, NIR-II fluorophores also suffer from poor water solubility, low
photostability, low quantum yield, and the scarcity of molecules with suitable NIR-II
band gaps have further limited the applications and development of NIR-II imaging
techniques. So far, a series of fluorophores with emission wavelengths longer than
1,000 nm in the NIR-II region have been designed based on the donor-acceptor-donor
scaffold (D-A-D). These NIR-II fluorophores are usually composed of various spacers
(thiophene), electron donor (fluorene and triphenylamine), and the central electronaccepting aromatic backbone (benzobisthiadiazole, BBTD), which can greatly expand
the library of small-molecule NIR-II fluorophores (Fig. 6) [31–33]. Fortunately, a series
of organic small molecules and organic and inorganic nanomaterials with precisely
Fig. 5 Fluorescence imaging of the cerebrovasculature of mice without craniotomy in the (a)
NIR-I, (b) NIR-II, and (c) NIR-IIb regions, with the corresponding SBR analysis shown in (d)–(f).
Scale bars, 2 mm. Reproduced from Ref. [30]
6
J. Tian et al.