

264
R. S. Kalb
Compound annual growth rates of patent applications show strong positive correlations with increased private R&D funding, venture capital, and—most importantly—market growth. In fact, CAGRs are one of the key indicators used by stock
exchange analysts and governments to predict market trends [10, 11]. This correlation is entirely plausible considering that patents are a mandatory requirement for
the economic exploitation of technologies and can be used to measure the market’s
ability to transfer scientific results into applied technologies. Technological growth is
compounded by the development of applied technologies, which increase intellectual
property (IP) developments, creating more patents.
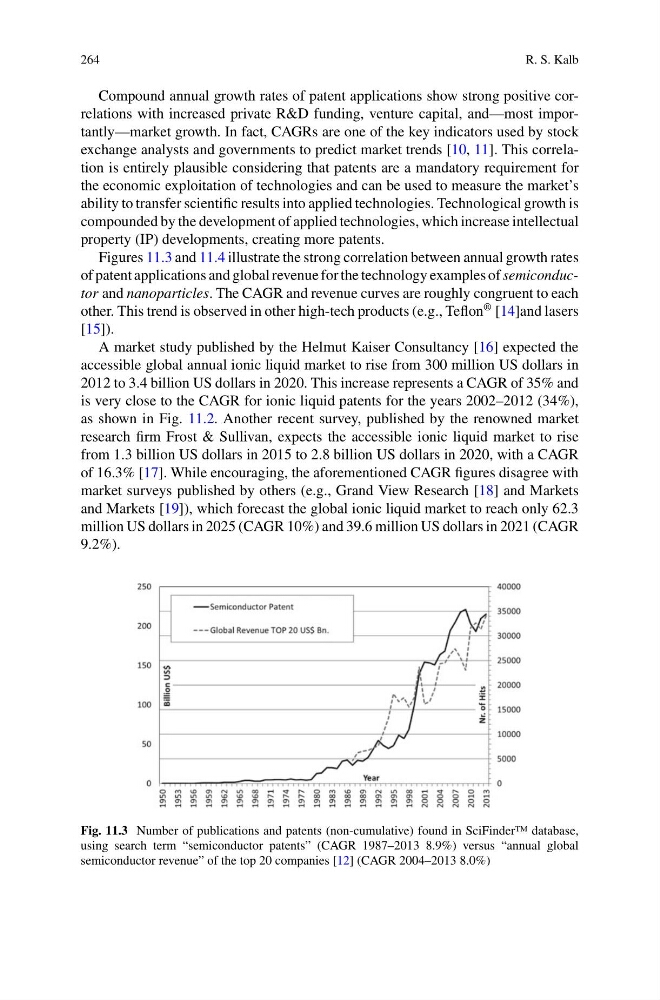
Figures 11.3 and 11.4 illustrate the strong correlation between annual growth rates
of patent applications and global revenue for the technology examples of semiconductor and nanoparticles. The CAGR and revenue curves are roughly congruent to each
other. This trend is observed in other high-tech products (e.g., Teflon
® [14]and lasers
[15]).
A market study published by the Helmut Kaiser Consultancy [16] expected the
accessible global annual ionic liquid market to rise from 300 million US dollars in
2012 to 3.4 billion US dollars in 2020. This increase represents a CAGR of 35% and
is very close to the CAGR for ionic liquid patents for the years 2002–2012 (34%),
as shown in Fig. 11.2. Another recent survey, published by the renowned market
research firm Frost & Sullivan, expects the accessible ionic liquid market to rise
from 1.3 billion US dollars in 2015 to 2.8 billion US dollars in 2020, with a CAGR
of 16.3% [17]. While encouraging, the aforementioned CAGR figures disagree with
market surveys published by others (e.g., Grand View Research [18] and Markets
and Markets [19]), which forecast the global ionic liquid market to reach only 62.3
million US dollars in 2025 (CAGR 10%) and 39.6 million US dollars in 2021 (CAGR
9.2%).
Fig. 11.3 Number of publications and patents (non-cumulative) found in SciFinder™ database,
using search term “semiconductor patents” (CAGR 1987–2013 8.9%) versus “annual global
semiconductor revenue” of the top 20 companies [12] (CAGR 2004–2013 8.0%)
R. S. Kalb
Compound annual growth rates of patent applications show strong positive correlations with increased private R&D funding, venture capital, and—most importantly—market growth. In fact, CAGRs are one of the key indicators used by stock
exchange analysts and governments to predict market trends [10, 11]. This correlation is entirely plausible considering that patents are a mandatory requirement for
the economic exploitation of technologies and can be used to measure the market’s
ability to transfer scientific results into applied technologies. Technological growth is
compounded by the development of applied technologies, which increase intellectual
property (IP) developments, creating more patents.
Figures 11.3 and 11.4 illustrate the strong correlation between annual growth rates
of patent applications and global revenue for the technology examples of semiconductor and nanoparticles. The CAGR and revenue curves are roughly congruent to each
other. This trend is observed in other high-tech products (e.g., Teflon
® [14]and lasers
[15]).
A market study published by the Helmut Kaiser Consultancy [16] expected the
accessible global annual ionic liquid market to rise from 300 million US dollars in
2012 to 3.4 billion US dollars in 2020. This increase represents a CAGR of 35% and
is very close to the CAGR for ionic liquid patents for the years 2002–2012 (34%),
as shown in Fig. 11.2. Another recent survey, published by the renowned market
research firm Frost & Sullivan, expects the accessible ionic liquid market to rise
from 1.3 billion US dollars in 2015 to 2.8 billion US dollars in 2020, with a CAGR
of 16.3% [17]. While encouraging, the aforementioned CAGR figures disagree with
market surveys published by others (e.g., Grand View Research [18] and Markets
and Markets [19]), which forecast the global ionic liquid market to reach only 62.3
million US dollars in 2025 (CAGR 10%) and 39.6 million US dollars in 2021 (CAGR
9.2%).
Fig. 11.3 Number of publications and patents (non-cumulative) found in SciFinder™ database,
using search term “semiconductor patents” (CAGR 1987–2013 8.9%) versus “annual global
semiconductor revenue” of the top 20 companies [12] (CAGR 2004–2013 8.0%)