

11 Toward Industrialization of Ionic Liquids
265
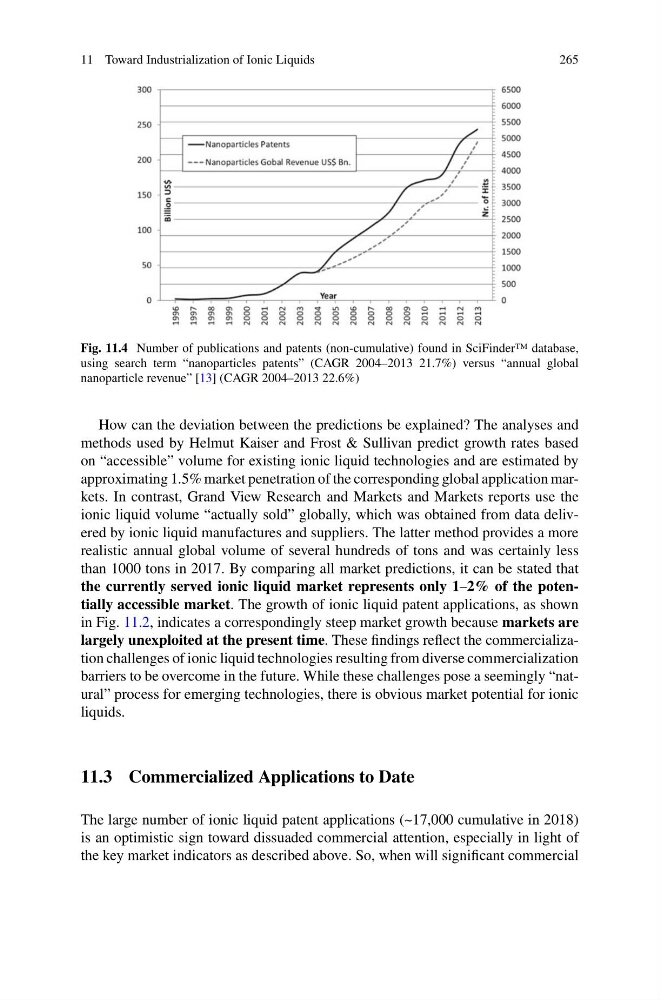
Fig. 11.4 Number of publications and patents (non-cumulative) found in SciFinder™ database,
using search term “nanoparticles patents” (CAGR 2004–2013 21.7%) versus “annual global
nanoparticle revenue” [13] (CAGR 2004–2013 22.6%)
How can the deviation between the predictions be explained? The analyses and
methods used by Helmut Kaiser and Frost & Sullivan predict growth rates based
on “accessible” volume for existing ionic liquid technologies and are estimated by
approximating 1.5% market penetration of the corresponding global application markets. In contrast, Grand View Research and Markets and Markets reports use the
ionic liquid volume “actually sold” globally, which was obtained from data delivered by ionic liquid manufactures and suppliers. The latter method provides a more
realistic annual global volume of several hundreds of tons and was certainly less
than 1000 tons in 2017. By comparing all market predictions, it can be stated that
the currently served ionic liquid market represents only 1–2% of the potentially accessible market. The growth of ionic liquid patent applications, as shown
in Fig. 11.2, indicates a correspondingly steep market growth because markets are
largely unexploited at the present time. These findings reflect the commercialization challenges of ionic liquid technologies resulting from diverse commercialization
barriers to be overcome in the future. While these challenges pose a seemingly “natural” process for emerging technologies, there is obvious market potential for ionic
liquids.
11.3 Commercialized Applications to Date
The large number of ionic liquid patent applications (~17,000 cumulative in 2018)
is an optimistic sign toward dissuaded commercial attention, especially in light of
the key market indicators as described above. So, when will significant commercial
265
Fig. 11.4 Number of publications and patents (non-cumulative) found in SciFinder™ database,
using search term “nanoparticles patents” (CAGR 2004–2013 21.7%) versus “annual global
nanoparticle revenue” [13] (CAGR 2004–2013 22.6%)
How can the deviation between the predictions be explained? The analyses and
methods used by Helmut Kaiser and Frost & Sullivan predict growth rates based
on “accessible” volume for existing ionic liquid technologies and are estimated by
approximating 1.5% market penetration of the corresponding global application markets. In contrast, Grand View Research and Markets and Markets reports use the
ionic liquid volume “actually sold” globally, which was obtained from data delivered by ionic liquid manufactures and suppliers. The latter method provides a more
realistic annual global volume of several hundreds of tons and was certainly less
than 1000 tons in 2017. By comparing all market predictions, it can be stated that
the currently served ionic liquid market represents only 1–2% of the potentially accessible market. The growth of ionic liquid patent applications, as shown
in Fig. 11.2, indicates a correspondingly steep market growth because markets are
largely unexploited at the present time. These findings reflect the commercialization challenges of ionic liquid technologies resulting from diverse commercialization
barriers to be overcome in the future. While these challenges pose a seemingly “natural” process for emerging technologies, there is obvious market potential for ionic
liquids.
11.3 Commercialized Applications to Date
The large number of ionic liquid patent applications (~17,000 cumulative in 2018)
is an optimistic sign toward dissuaded commercial attention, especially in light of
the key market indicators as described above. So, when will significant commercial