

11 Toward Industrialization of Ionic Liquids
263
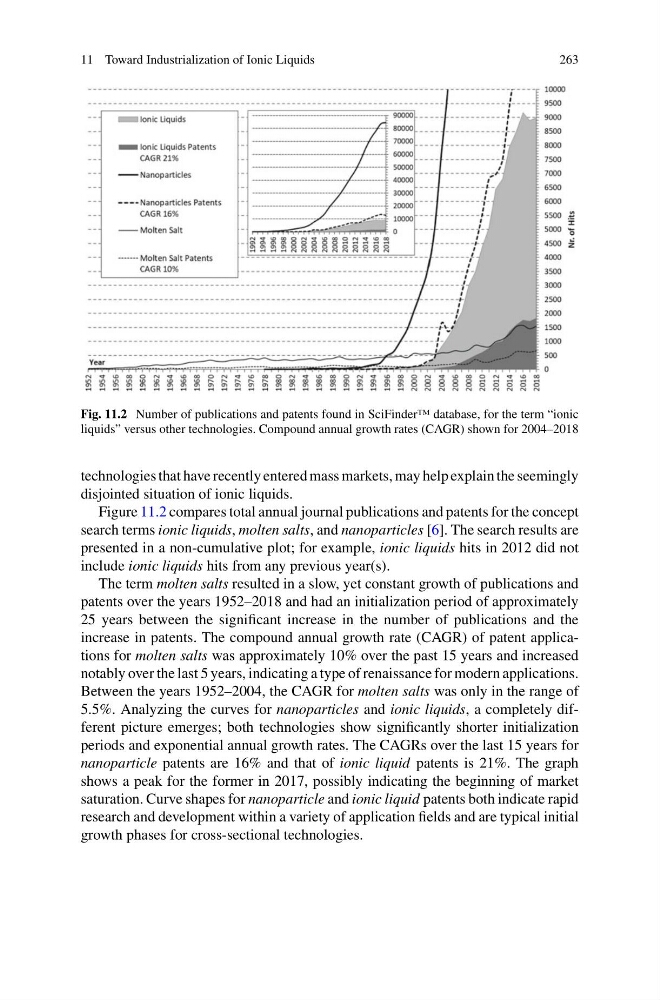
Fig. 11.2 Number of publications and patents found in SciFinder™ database, for the term “ionic
liquids” versus other technologies. Compound annual growth rates (CAGR) shown for 2004–2018
technologies that have recently entered mass markets, may help explain the seemingly
disjointed situation of ionic liquids.
Figure 11.2 compares total annual journal publications and patents for the concept
search terms ionic liquids, molten salts, and nanoparticles [6]. The search results are
presented in a non-cumulative plot; for example, ionic liquids hits in 2012 did not
include ionic liquids hits from any previous year(s).
The term molten salts resulted in a slow, yet constant growth of publications and
patents over the years 1952–2018 and had an initialization period of approximately
25 years between the significant increase in the number of publications and the
increase in patents. The compound annual growth rate (CAGR) of patent applications for molten salts was approximately 10% over the past 15 years and increased
notably over the last 5 years, indicating a type of renaissance for modern applications.
Between the years 1952–2004, the CAGR for molten salts was only in the range of
5.5%. Analyzing the curves for nanoparticles and ionic liquids, a completely different picture emerges; both technologies show significantly shorter initialization
periods and exponential annual growth rates. The CAGRs over the last 15 years for
nanoparticle patents are 16% and that of ionic liquid patents is 21%. The graph
shows a peak for the former in 2017, possibly indicating the beginning of market
saturation. Curve shapes for nanoparticle and ionic liquid patents both indicate rapid
research and development within a variety of application fields and are typical initial
growth phases for cross-sectional technologies.
263
Fig. 11.2 Number of publications and patents found in SciFinder™ database, for the term “ionic
liquids” versus other technologies. Compound annual growth rates (CAGR) shown for 2004–2018
technologies that have recently entered mass markets, may help explain the seemingly
disjointed situation of ionic liquids.
Figure 11.2 compares total annual journal publications and patents for the concept
search terms ionic liquids, molten salts, and nanoparticles [6]. The search results are
presented in a non-cumulative plot; for example, ionic liquids hits in 2012 did not
include ionic liquids hits from any previous year(s).
The term molten salts resulted in a slow, yet constant growth of publications and
patents over the years 1952–2018 and had an initialization period of approximately
25 years between the significant increase in the number of publications and the
increase in patents. The compound annual growth rate (CAGR) of patent applications for molten salts was approximately 10% over the past 15 years and increased
notably over the last 5 years, indicating a type of renaissance for modern applications.
Between the years 1952–2004, the CAGR for molten salts was only in the range of
5.5%. Analyzing the curves for nanoparticles and ionic liquids, a completely different picture emerges; both technologies show significantly shorter initialization
periods and exponential annual growth rates. The CAGRs over the last 15 years for
nanoparticle patents are 16% and that of ionic liquid patents is 21%. The graph
shows a peak for the former in 2017, possibly indicating the beginning of market
saturation. Curve shapes for nanoparticle and ionic liquid patents both indicate rapid
research and development within a variety of application fields and are typical initial
growth phases for cross-sectional technologies.