

180
L. Brown et al.
0
10
20
30
40
50
60
70
80
90
100
0
5
10
15
20
25
30
% Ionic Liquid Stationary Phase Retention
Flow Rate / cm 3 min -1
70 Bar Pressure
Limit
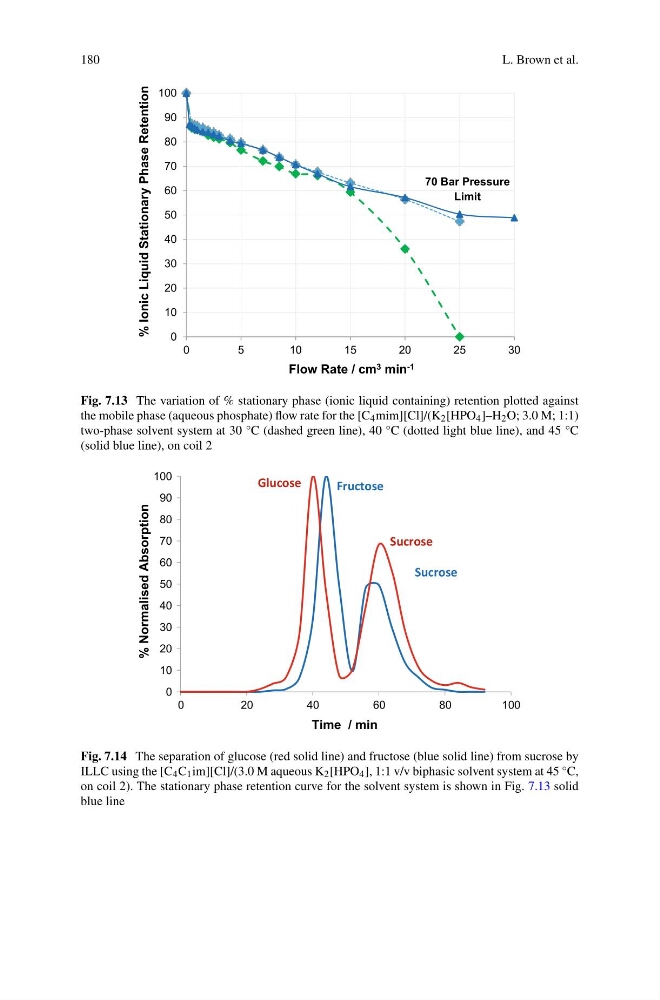
Fig. 7.13 The variation of % stationary phase (ionic liquid containing) retention plotted against
the mobile phase (aqueous phosphate) flow rate for the [C 4 mim][Cl]/(K 2 [HPO 4 ]–H 2 O; 3.0 M; 1:1)
two-phase solvent system at 30 °C (dashed green line), 40 °C (dotted light blue line), and 45 °C
(solid blue line), on coil 2
0
10
20
30
40
50
60
70
80
90
100
0
2 0
4 0
6 0
8 0
1 0 0
% Normalised Absorption
Time / min
Glucose
Fructose
Sucrose
Sucrose
Fig. 7.14 The separation of glucose (red solid line) and fructose (blue solid line) from sucrose by
ILLC using the [C 4 C 1 im][Cl]/(3.0 M aqueous K 2 [HPO 4 ], 1:1 v/v biphasic solvent system at 45 °C,
on coil 2). The stationary phase retention curve for the solvent system is shown in Fig. 7.13 solid
blue line
L. Brown et al.
0
10
20
30
40
50
60
70
80
90
100
0
5
10
15
20
25
30
% Ionic Liquid Stationary Phase Retention
Flow Rate / cm 3 min -1
70 Bar Pressure
Limit
Fig. 7.13 The variation of % stationary phase (ionic liquid containing) retention plotted against
the mobile phase (aqueous phosphate) flow rate for the [C 4 mim][Cl]/(K 2 [HPO 4 ]–H 2 O; 3.0 M; 1:1)
two-phase solvent system at 30 °C (dashed green line), 40 °C (dotted light blue line), and 45 °C
(solid blue line), on coil 2
0
10
20
30
40
50
60
70
80
90
100
0
2 0
4 0
6 0
8 0
1 0 0
% Normalised Absorption
Time / min
Glucose
Fructose
Sucrose
Sucrose
Fig. 7.14 The separation of glucose (red solid line) and fructose (blue solid line) from sucrose by
ILLC using the [C 4 C 1 im][Cl]/(3.0 M aqueous K 2 [HPO 4 ], 1:1 v/v biphasic solvent system at 45 °C,
on coil 2). The stationary phase retention curve for the solvent system is shown in Fig. 7.13 solid
blue line