

7 Ionic Liquid–Liquid Chromatography: A Novel Separation Method
179
0
10
20
30
40
50
60
70
80
90
100
0
1 0
2 0
3 0
4 0
5 0
6 0
7 0
% Normalised Absorbtion
Time / min
Ni 313K
Co 313K
Cu 313K
Ni 303K
Co 303K
Cu 303K
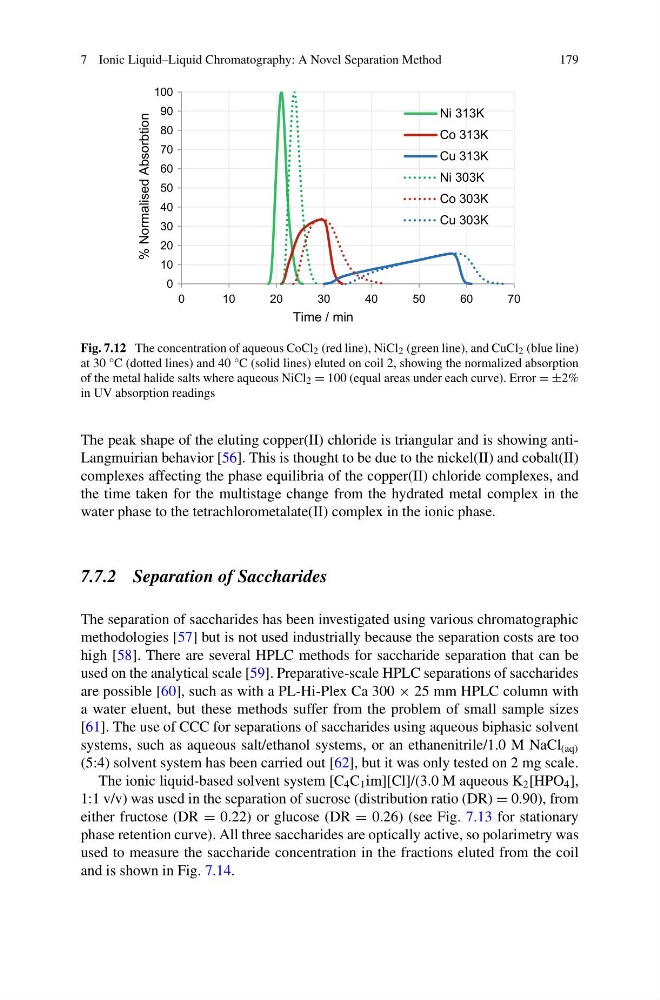
Fig. 7.12 The concentration of aqueous CoCl 2 (red line), NiCl 2 (green line), and CuCl 2 (blue line)
at 30 °C (dotted lines) and 40 °C (solid lines) eluted on coil 2, showing the normalized absorption
of the metal halide salts where aqueous NiCl 2 = 100 (equal areas under each curve). Error = ±2%
in UV absorption readings
The peak shape of the eluting copper(II) chloride is triangular and is showing antiLangmuirian behavior [56]. This is thought to be due to the nickel(II) and cobalt(II)
complexes affecting the phase equilibria of the copper(II) chloride complexes, and
the time taken for the multistage change from the hydrated metal complex in the
water phase to the tetrachlorometalate(II) complex in the ionic phase.
7.7.2 Separation of Saccharides
The separation of saccharides has been investigated using various chromatographic
methodologies [57] but is not used industrially because the separation costs are too
high [58]. There are several HPLC methods for saccharide separation that can be
used on the analytical scale [59]. Preparative-scale HPLC separations of saccharides
are possible [60], such as with a PL-Hi-Plex Ca 300 × 25 mm HPLC column with
a water eluent, but these methods suffer from the problem of small sample sizes
[61]. The use of CCC for separations of saccharides using aqueous biphasic solvent
systems, such as aqueous salt/ethanol systems, or an ethanenitrile/1.0 M NaCl (aq)
(5:4) solvent system has been carried out [62], but it was only tested on 2 mg scale.
The ionic liquid-based solvent system [C 4 C 1 im][Cl]/(3.0 M aqueous K 2 [HPO 4 ],
1:1 v/v) was used in the separation of sucrose (distribution ratio (DR) = 0.90), from
either fructose (DR = 0.22) or glucose (DR = 0.26) (see Fig. 7.13 for stationary
phase retention curve). All three saccharides are optically active, so polarimetry was
used to measure the saccharide concentration in the fractions eluted from the coil
and is shown in Fig. 7.14.
179
0
10
20
30
40
50
60
70
80
90
100
0
1 0
2 0
3 0
4 0
5 0
6 0
7 0
% Normalised Absorbtion
Time / min
Ni 313K
Co 313K
Cu 313K
Ni 303K
Co 303K
Cu 303K
Fig. 7.12 The concentration of aqueous CoCl 2 (red line), NiCl 2 (green line), and CuCl 2 (blue line)
at 30 °C (dotted lines) and 40 °C (solid lines) eluted on coil 2, showing the normalized absorption
of the metal halide salts where aqueous NiCl 2 = 100 (equal areas under each curve). Error = ±2%
in UV absorption readings
The peak shape of the eluting copper(II) chloride is triangular and is showing antiLangmuirian behavior [56]. This is thought to be due to the nickel(II) and cobalt(II)
complexes affecting the phase equilibria of the copper(II) chloride complexes, and
the time taken for the multistage change from the hydrated metal complex in the
water phase to the tetrachlorometalate(II) complex in the ionic phase.
7.7.2 Separation of Saccharides
The separation of saccharides has been investigated using various chromatographic
methodologies [57] but is not used industrially because the separation costs are too
high [58]. There are several HPLC methods for saccharide separation that can be
used on the analytical scale [59]. Preparative-scale HPLC separations of saccharides
are possible [60], such as with a PL-Hi-Plex Ca 300 × 25 mm HPLC column with
a water eluent, but these methods suffer from the problem of small sample sizes
[61]. The use of CCC for separations of saccharides using aqueous biphasic solvent
systems, such as aqueous salt/ethanol systems, or an ethanenitrile/1.0 M NaCl (aq)
(5:4) solvent system has been carried out [62], but it was only tested on 2 mg scale.
The ionic liquid-based solvent system [C 4 C 1 im][Cl]/(3.0 M aqueous K 2 [HPO 4 ],
1:1 v/v) was used in the separation of sucrose (distribution ratio (DR) = 0.90), from
either fructose (DR = 0.22) or glucose (DR = 0.26) (see Fig. 7.13 for stationary
phase retention curve). All three saccharides are optically active, so polarimetry was
used to measure the saccharide concentration in the fractions eluted from the coil
and is shown in Fig. 7.14.