

1.274 °C from June to October in the last
50 years. Its intra-seasonal temperature growth
has witnessed a variation ranging from 0.735 °C
in August to 1.666 °C in September. The monsoon season nocturnal temperature growth has
exceeded the corresponding daytime temperature
growth by 1.17 times in Hyderabad. The winter
season nocturnal urban heat dome growth has
been 1.46 times higher than the early summer
season nocturnal heat dome of April to May.
During the transitional month of November,
the nocturnal heat dome in the tropical city of
Hyderabad shows a still higher heat growth by an
additional 1.911 °C. This transitional month
recorded a much higher heat growth in comparison to the overall summer season heat growth.
In case of Hyderabad, the winter season warming
is more pronounced both during the daytime as
well as the nights. A pronounced winter warming
indicates a rapidly warming winter in Hyderabad
both during the day as well as night. It appears a
very dangerous sign of urban heat island with a
diluting winter effect.
5.4.3 Mean Monthly Average
Temperature Transition:
Hyderabad
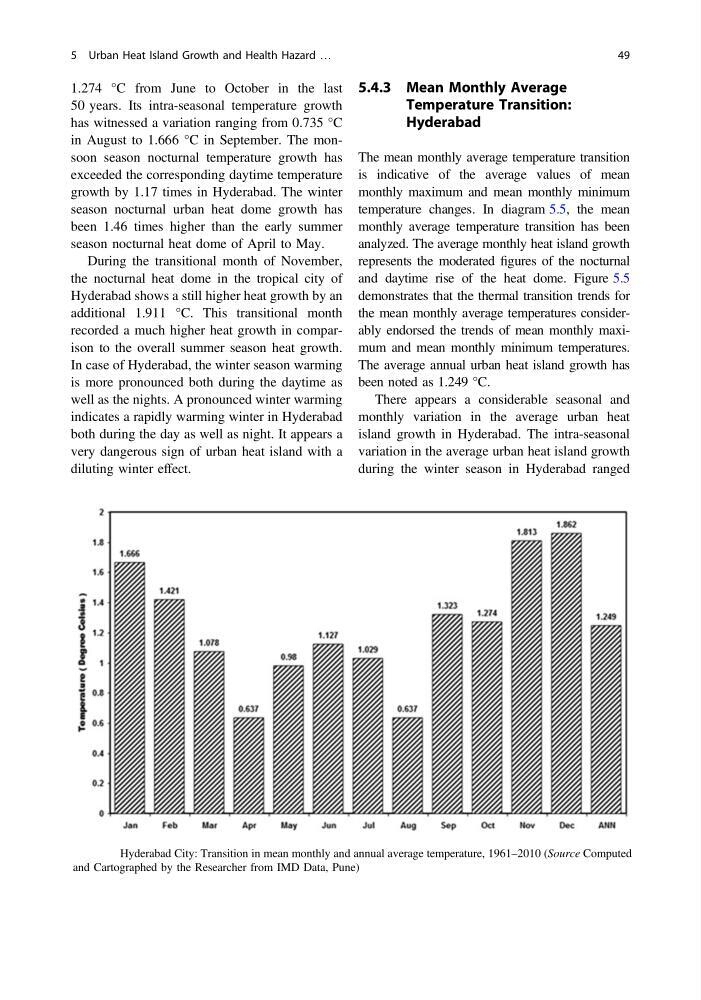
The mean monthly average temperature transition
is indicative of the average values of mean
monthly maximum and mean monthly minimum
temperature changes. In diagram 5.5, the mean
monthly average temperature transition has been
analyzed. The average monthly heat island growth
represents the moderated figures of the nocturnal
and daytime rise of the heat dome. Figure 5.5
demonstrates that the thermal transition trends for
the mean monthly average temperatures considerably endorsed the trends of mean monthly maximum and mean monthly minimum temperatures.
The average annual urban heat island growth has
been noted as 1.249 °C.
There appears a considerable seasonal and
monthly variation in the average urban heat
island growth in Hyderabad. The intra-seasonal
variation in the average urban heat island growth
during the winter season in Hyderabad ranged
Fig. 5.5 Hyderabad City: Transition in mean monthly and annual average temperature, 1961–2010 (Source Computed
and Cartographed by the Researcher from IMD Data, Pune)
5 Urban Heat Island Growth and Health Hazard …
49
50 years. Its intra-seasonal temperature growth
has witnessed a variation ranging from 0.735 °C
in August to 1.666 °C in September. The monsoon season nocturnal temperature growth has
exceeded the corresponding daytime temperature
growth by 1.17 times in Hyderabad. The winter
season nocturnal urban heat dome growth has
been 1.46 times higher than the early summer
season nocturnal heat dome of April to May.
During the transitional month of November,
the nocturnal heat dome in the tropical city of
Hyderabad shows a still higher heat growth by an
additional 1.911 °C. This transitional month
recorded a much higher heat growth in comparison to the overall summer season heat growth.
In case of Hyderabad, the winter season warming
is more pronounced both during the daytime as
well as the nights. A pronounced winter warming
indicates a rapidly warming winter in Hyderabad
both during the day as well as night. It appears a
very dangerous sign of urban heat island with a
diluting winter effect.
5.4.3 Mean Monthly Average
Temperature Transition:
Hyderabad
The mean monthly average temperature transition
is indicative of the average values of mean
monthly maximum and mean monthly minimum
temperature changes. In diagram 5.5, the mean
monthly average temperature transition has been
analyzed. The average monthly heat island growth
represents the moderated figures of the nocturnal
and daytime rise of the heat dome. Figure 5.5
demonstrates that the thermal transition trends for
the mean monthly average temperatures considerably endorsed the trends of mean monthly maximum and mean monthly minimum temperatures.
The average annual urban heat island growth has
been noted as 1.249 °C.
There appears a considerable seasonal and
monthly variation in the average urban heat
island growth in Hyderabad. The intra-seasonal
variation in the average urban heat island growth
during the winter season in Hyderabad ranged
Fig. 5.5 Hyderabad City: Transition in mean monthly and annual average temperature, 1961–2010 (Source Computed
and Cartographed by the Researcher from IMD Data, Pune)
5 Urban Heat Island Growth and Health Hazard …
49