

1.225 °C in October. The daytime urban heat
island growth in the transitional season of
November is 1.666 °C. The monthly daytime
heat island growth was the highest 1.813 °C in
February while the lowest daytime monthly heat
island growth was 0.49 °C in August. The
monthly daytime heat island growth has a
warming amplitude of 3.7 times between the
minimum and the maximum heat intensity.
However, a significant daytime heat island finding is that all the months have recorded a consistent rise in the urban heat dome.
5.4.2 Mean Monthly Minimum
Temperature Transition:
Hyderabad
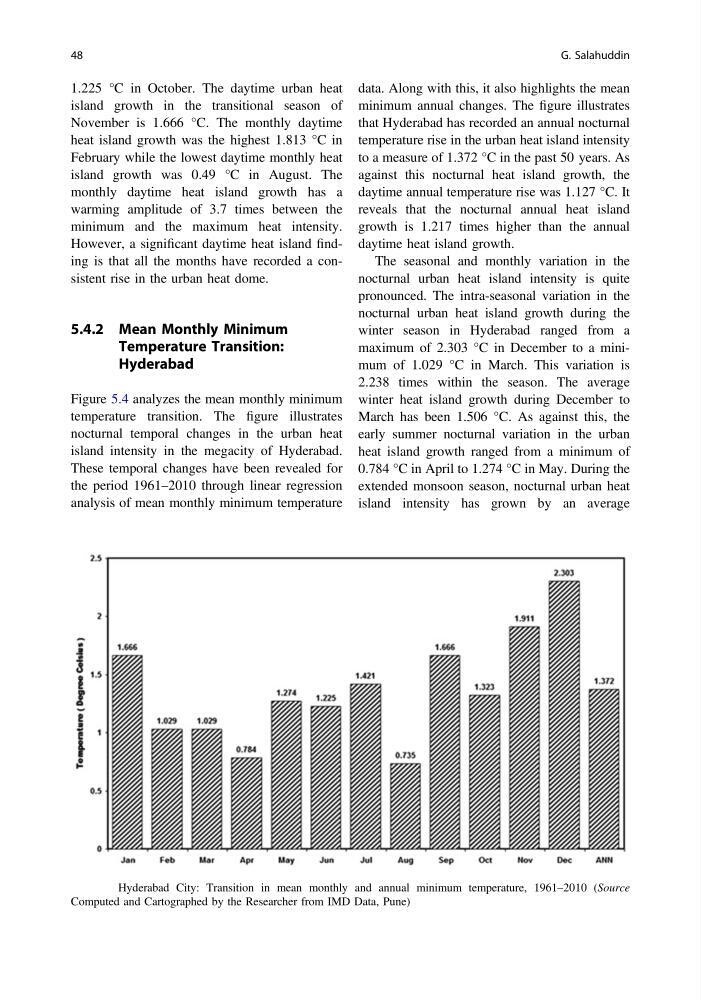
Figure 5.4 analyzes the mean monthly minimum
temperature transition. The figure illustrates
nocturnal temporal changes in the urban heat
island intensity in the megacity of Hyderabad.
These temporal changes have been revealed for
the period 1961–2010 through linear regression
analysis of mean monthly minimum temperature
data. Along with this, it also highlights the mean
minimum annual changes. The figure illustrates
that Hyderabad has recorded an annual nocturnal
temperature rise in the urban heat island intensity
to a measure of 1.372 °C in the past 50 years. As
against this nocturnal heat island growth, the
daytime annual temperature rise was 1.127 °C. It
reveals that the nocturnal annual heat island
growth is 1.217 times higher than the annual
daytime heat island growth.
The seasonal and monthly variation in the
nocturnal urban heat island intensity is quite
pronounced. The intra-seasonal variation in the
nocturnal urban heat island growth during the
winter season in Hyderabad ranged from a
maximum of 2.303 °C in December to a minimum of 1.029 °C in March. This variation is
2.238 times within the season. The average
winter heat island growth during December to
March has been 1.506 °C. As against this, the
early summer nocturnal variation in the urban
heat island growth ranged from a minimum of
0.784 °C in April to 1.274 °C in May. During the
extended monsoon season, nocturnal urban heat
island intensity has grown by an average
Fig. 5.4 Hyderabad City: Transition in mean monthly and annual minimum temperature, 1961–2010 (Source
Computed and Cartographed by the Researcher from IMD Data, Pune)
48
G. Salahuddin
island growth in the transitional season of
November is 1.666 °C. The monthly daytime
heat island growth was the highest 1.813 °C in
February while the lowest daytime monthly heat
island growth was 0.49 °C in August. The
monthly daytime heat island growth has a
warming amplitude of 3.7 times between the
minimum and the maximum heat intensity.
However, a significant daytime heat island finding is that all the months have recorded a consistent rise in the urban heat dome.
5.4.2 Mean Monthly Minimum
Temperature Transition:
Hyderabad
Figure 5.4 analyzes the mean monthly minimum
temperature transition. The figure illustrates
nocturnal temporal changes in the urban heat
island intensity in the megacity of Hyderabad.
These temporal changes have been revealed for
the period 1961–2010 through linear regression
analysis of mean monthly minimum temperature
data. Along with this, it also highlights the mean
minimum annual changes. The figure illustrates
that Hyderabad has recorded an annual nocturnal
temperature rise in the urban heat island intensity
to a measure of 1.372 °C in the past 50 years. As
against this nocturnal heat island growth, the
daytime annual temperature rise was 1.127 °C. It
reveals that the nocturnal annual heat island
growth is 1.217 times higher than the annual
daytime heat island growth.
The seasonal and monthly variation in the
nocturnal urban heat island intensity is quite
pronounced. The intra-seasonal variation in the
nocturnal urban heat island growth during the
winter season in Hyderabad ranged from a
maximum of 2.303 °C in December to a minimum of 1.029 °C in March. This variation is
2.238 times within the season. The average
winter heat island growth during December to
March has been 1.506 °C. As against this, the
early summer nocturnal variation in the urban
heat island growth ranged from a minimum of
0.784 °C in April to 1.274 °C in May. During the
extended monsoon season, nocturnal urban heat
island intensity has grown by an average
Fig. 5.4 Hyderabad City: Transition in mean monthly and annual minimum temperature, 1961–2010 (Source
Computed and Cartographed by the Researcher from IMD Data, Pune)
48
G. Salahuddin