

5.4.1 Mean Monthly Maximum
Temperature Transition:
Hyderabad
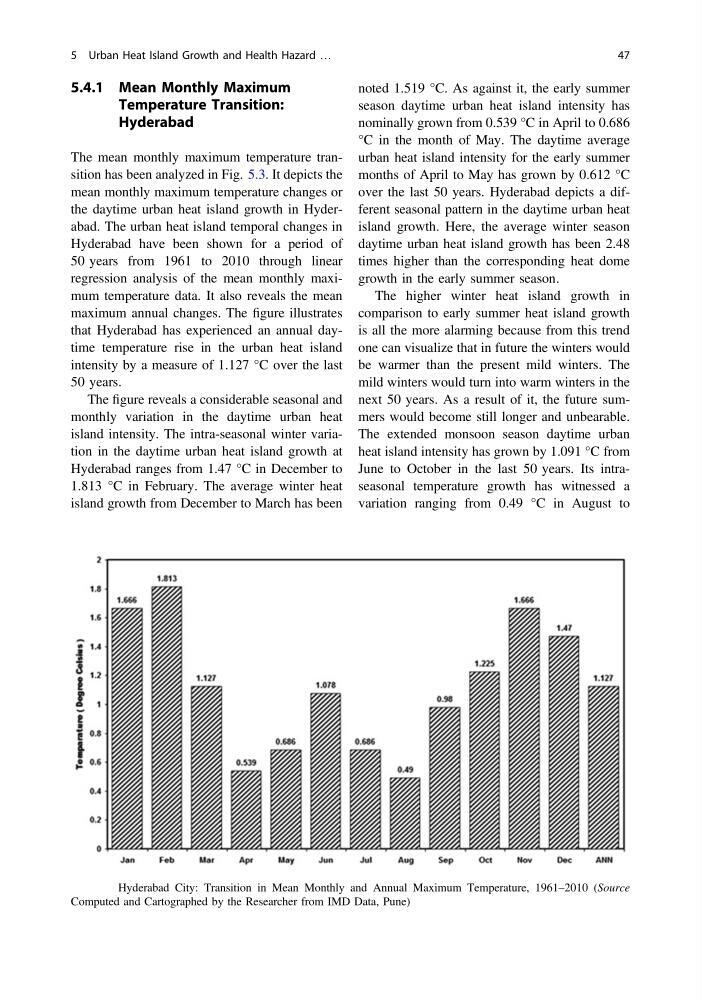
The mean monthly maximum temperature transition has been analyzed in Fig. 5.3. It depicts the
mean monthly maximum temperature changes or
the daytime urban heat island growth in Hyderabad. The urban heat island temporal changes in
Hyderabad have been shown for a period of
50 years from 1961 to 2010 through linear
regression analysis of the mean monthly maximum temperature data. It also reveals the mean
maximum annual changes. The figure illustrates
that Hyderabad has experienced an annual daytime temperature rise in the urban heat island
intensity by a measure of 1.127 °C over the last
50 years.
The figure reveals a considerable seasonal and
monthly variation in the daytime urban heat
island intensity. The intra-seasonal winter variation in the daytime urban heat island growth at
Hyderabad ranges from 1.47 °C in December to
1.813 °C in February. The average winter heat
island growth from December to March has been
noted 1.519 °C. As against it, the early summer
season daytime urban heat island intensity has
nominally grown from 0.539 °C in April to 0.686
°C in the month of May. The daytime average
urban heat island intensity for the early summer
months of April to May has grown by 0.612 °C
over the last 50 years. Hyderabad depicts a different seasonal pattern in the daytime urban heat
island growth. Here, the average winter season
daytime urban heat island growth has been 2.48
times higher than the corresponding heat dome
growth in the early summer season.
The higher winter heat island growth in
comparison to early summer heat island growth
is all the more alarming because from this trend
one can visualize that in future the winters would
be warmer than the present mild winters. The
mild winters would turn into warm winters in the
next 50 years. As a result of it, the future summers would become still longer and unbearable.
The extended monsoon season daytime urban
heat island intensity has grown by 1.091 °C from
June to October in the last 50 years. Its intraseasonal temperature growth has witnessed a
variation ranging from 0.49 °C in August to
Fig. 5.3 Hyderabad City: Transition in Mean Monthly and Annual Maximum Temperature, 1961–2010 (Source
Computed and Cartographed by the Researcher from IMD Data, Pune)
5 Urban Heat Island Growth and Health Hazard …
47
Temperature Transition:
Hyderabad
The mean monthly maximum temperature transition has been analyzed in Fig. 5.3. It depicts the
mean monthly maximum temperature changes or
the daytime urban heat island growth in Hyderabad. The urban heat island temporal changes in
Hyderabad have been shown for a period of
50 years from 1961 to 2010 through linear
regression analysis of the mean monthly maximum temperature data. It also reveals the mean
maximum annual changes. The figure illustrates
that Hyderabad has experienced an annual daytime temperature rise in the urban heat island
intensity by a measure of 1.127 °C over the last
50 years.
The figure reveals a considerable seasonal and
monthly variation in the daytime urban heat
island intensity. The intra-seasonal winter variation in the daytime urban heat island growth at
Hyderabad ranges from 1.47 °C in December to
1.813 °C in February. The average winter heat
island growth from December to March has been
noted 1.519 °C. As against it, the early summer
season daytime urban heat island intensity has
nominally grown from 0.539 °C in April to 0.686
°C in the month of May. The daytime average
urban heat island intensity for the early summer
months of April to May has grown by 0.612 °C
over the last 50 years. Hyderabad depicts a different seasonal pattern in the daytime urban heat
island growth. Here, the average winter season
daytime urban heat island growth has been 2.48
times higher than the corresponding heat dome
growth in the early summer season.
The higher winter heat island growth in
comparison to early summer heat island growth
is all the more alarming because from this trend
one can visualize that in future the winters would
be warmer than the present mild winters. The
mild winters would turn into warm winters in the
next 50 years. As a result of it, the future summers would become still longer and unbearable.
The extended monsoon season daytime urban
heat island intensity has grown by 1.091 °C from
June to October in the last 50 years. Its intraseasonal temperature growth has witnessed a
variation ranging from 0.49 °C in August to
Fig. 5.3 Hyderabad City: Transition in Mean Monthly and Annual Maximum Temperature, 1961–2010 (Source
Computed and Cartographed by the Researcher from IMD Data, Pune)
5 Urban Heat Island Growth and Health Hazard …
47