

from a maximum of 1.862 °C in December to a
minimum of 1.078 °C in March. This heat island
growth in winters is no less alarming. The
average winter season heat island growth during
the 4 months from December to March has been
1.506 °C. On the other hand, the average intrasummer season variation including monsoon
showed an urban heat island growth ranging
from a minimum of 0.637 °C in April to a
maximum of 1.323 °C in September. The average urban heat island growth in the characteristically hot months of June and July is also
considerably high at 1.127 °C and 1.029 °C,
respectively. This will have long-term adverse
effects on the urban living and the rising energy
demand for a cooling effect. The increased
cooling energy consumption would have a
compound effect on the heat island seasonal
expansion and the heat dome height. Of all the
months, the highest monthly average heat island
growth has been recorded 1.862 °C in the winter
month of December. This nearly 2 °C heat rise is
indicative of the rapidly warming winter season.
The seasonal average heat dome rise for the
summers was 1.001 °C during April to October.
The average winter season urban heat dome rise
was 1.5 times higher than the average summer
season heat dome rise. The extended monsoon
season daily average heat island intensity has
grown by 1.078 °C from June to October. Its
intra-seasonal temperature growth has witnessed
a variation ranging from 0.637 °C in August to
1.323 °C in September. The average monthly
heat dome rise in the transitional month of
November was 1.813 °C.
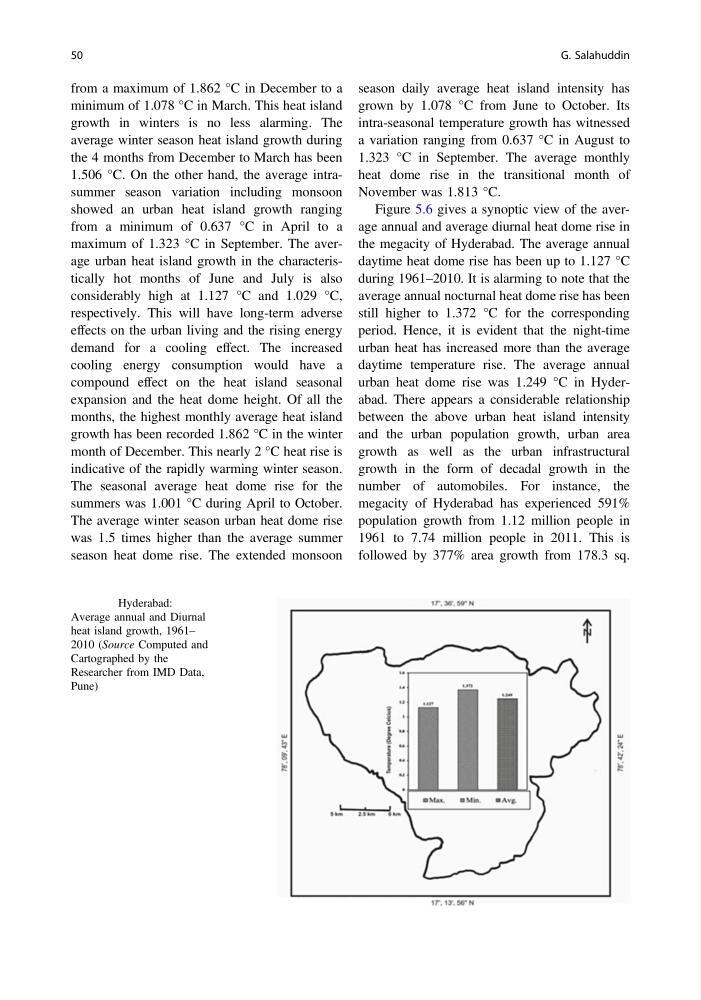
Figure 5.6 gives a synoptic view of the average annual and average diurnal heat dome rise in
the megacity of Hyderabad. The average annual
daytime heat dome rise has been up to 1.127 °C
during 1961–2010. It is alarming to note that the
average annual nocturnal heat dome rise has been
still higher to 1.372 °C for the corresponding
period. Hence, it is evident that the night-time
urban heat has increased more than the average
daytime temperature rise. The average annual
urban heat dome rise was 1.249 °C in Hyderabad. There appears a considerable relationship
between the above urban heat island intensity
and the urban population growth, urban area
growth as well as the urban infrastructural
growth in the form of decadal growth in the
number of automobiles. For instance, the
megacity of Hyderabad has experienced 591%
population growth from 1.12 million people in
1961 to 7.74 million people in 2011. This is
followed by 377% area growth from 178.3 sq.
Fig. 5.6 Hyderabad:
Average annual and Diurnal
heat island growth, 1961–
2010 (Source Computed and
Cartographed by the
Researcher from IMD Data,
Pune)
50
G. Salahuddin
minimum of 1.078 °C in March. This heat island
growth in winters is no less alarming. The
average winter season heat island growth during
the 4 months from December to March has been
1.506 °C. On the other hand, the average intrasummer season variation including monsoon
showed an urban heat island growth ranging
from a minimum of 0.637 °C in April to a
maximum of 1.323 °C in September. The average urban heat island growth in the characteristically hot months of June and July is also
considerably high at 1.127 °C and 1.029 °C,
respectively. This will have long-term adverse
effects on the urban living and the rising energy
demand for a cooling effect. The increased
cooling energy consumption would have a
compound effect on the heat island seasonal
expansion and the heat dome height. Of all the
months, the highest monthly average heat island
growth has been recorded 1.862 °C in the winter
month of December. This nearly 2 °C heat rise is
indicative of the rapidly warming winter season.
The seasonal average heat dome rise for the
summers was 1.001 °C during April to October.
The average winter season urban heat dome rise
was 1.5 times higher than the average summer
season heat dome rise. The extended monsoon
season daily average heat island intensity has
grown by 1.078 °C from June to October. Its
intra-seasonal temperature growth has witnessed
a variation ranging from 0.637 °C in August to
1.323 °C in September. The average monthly
heat dome rise in the transitional month of
November was 1.813 °C.
Figure 5.6 gives a synoptic view of the average annual and average diurnal heat dome rise in
the megacity of Hyderabad. The average annual
daytime heat dome rise has been up to 1.127 °C
during 1961–2010. It is alarming to note that the
average annual nocturnal heat dome rise has been
still higher to 1.372 °C for the corresponding
period. Hence, it is evident that the night-time
urban heat has increased more than the average
daytime temperature rise. The average annual
urban heat dome rise was 1.249 °C in Hyderabad. There appears a considerable relationship
between the above urban heat island intensity
and the urban population growth, urban area
growth as well as the urban infrastructural
growth in the form of decadal growth in the
number of automobiles. For instance, the
megacity of Hyderabad has experienced 591%
population growth from 1.12 million people in
1961 to 7.74 million people in 2011. This is
followed by 377% area growth from 178.3 sq.
Fig. 5.6 Hyderabad:
Average annual and Diurnal
heat island growth, 1961–
2010 (Source Computed and
Cartographed by the
Researcher from IMD Data,
Pune)
50
G. Salahuddin