

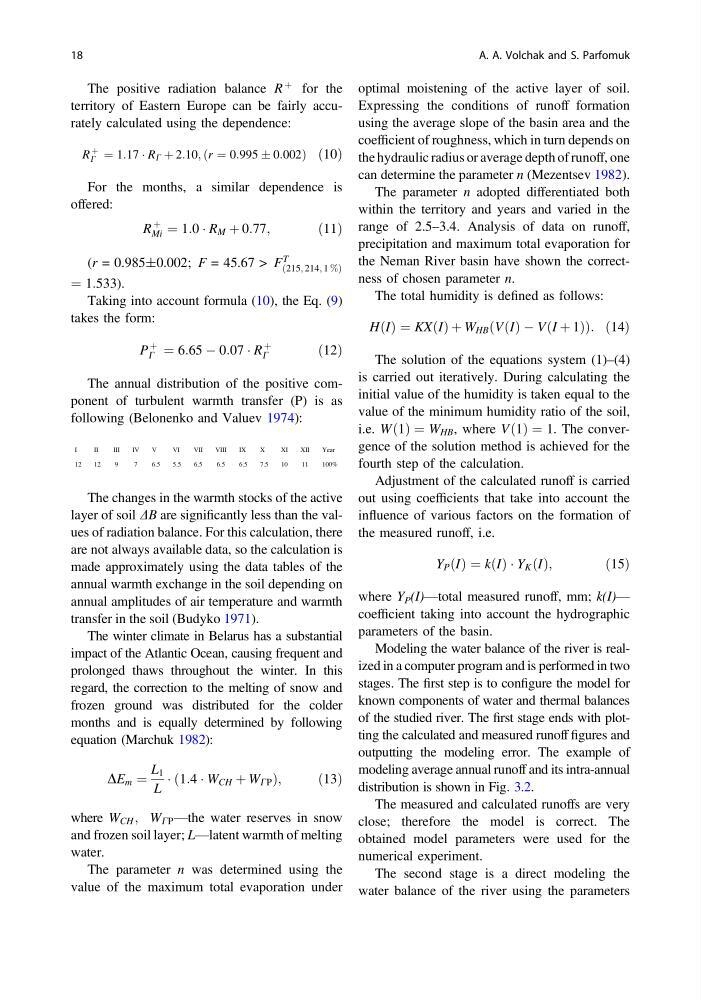
The positive radiation balance R
þ for the
territory of Eastern Europe can be fairly accurately calculated using the dependence:
R
þ
C ¼ 1:17 Á R C þ 2:10; ðr ¼ 0:995 Æ 0:002Þ ð10Þ
For the months, a similar dependence is
offered:
R
þ
Mi ¼ 1:0 Á R M þ 0:77;
ð11Þ
(r = 0.985±0.002; F = 45.67 > F
T
215; 214; 1 %
ð
Þ
¼ 1:533).
Taking into account formula (10), the Eq. (9)
takes the form:
P
þ
C ¼ 6:65 À 0:07 Á R
þ
C
ð12Þ
The annual distribution of the positive component of turbulent warmth transfer (P) is as
following (Belonenko and Valuev 1974):
I
II
III
IV
V
VI
VII
VIII
IX
X
XI
XII
Year
12
12
9
7
6.5
5.5
6.5
6.5
6.5
7.5
10
11
100%
The changes in the warmth stocks of the active
layer of soil DB are significantly less than the values of radiation balance. For this calculation, there
are not always available data, so the calculation is
made approximately using the data tables of the
annual warmth exchange in the soil depending on
annual amplitudes of air temperature and warmth
transfer in the soil (Budyko 1971).
The winter climate in Belarus has a substantial
impact of the Atlantic Ocean, causing frequent and
prolonged thaws throughout the winter. In this
regard, the correction to the melting of snow and
frozen ground was distributed for the colder
months and is equally determined by following
equation (Marchuk 1982):
DE m ¼
L 1
L
Á 1:4 Á W CH þ W CP
ð
Þ ;
ð13Þ
where W CH ; W CP —the water reserves in snow
and frozen soil layer; L—latent warmth of melting
water.
The parameter n was determined using the
value of the maximum total evaporation under
optimal moistening of the active layer of soil.
Expressing the conditions of runoff formation
using the average slope of the basin area and the
coefficient of roughness, which in turn depends on
the hydraulic radius or average depth of runoff, one
can determine the parameter n (Mezentsev 1982).
The parameter n adopted differentiated both
within the territory and years and varied in the
range of 2.5–3.4. Analysis of data on runoff,
precipitation and maximum total evaporation for
the Neman River basin have shown the correctness of chosen parameter n.
The total humidity is defined as follows:
HðIÞ ¼ KXðIÞ þ W HB ðVðIÞ À VðI þ 1ÞÞ: ð14Þ
The solution of the equations system (1)–(4)
is carried out iteratively. During calculating the
initial value of the humidity is taken equal to the
value of the minimum humidity ratio of the soil,
i.e. Wð1Þ ¼ W HB , where Vð1Þ ¼ 1. The convergence of the solution method is achieved for the
fourth step of the calculation.
Adjustment of the calculated runoff is carried
out using coefficients that take into account the
influence of various factors on the formation of
the measured runoff, i.e.
Y P ðIÞ ¼ kðIÞ Á Y K ðIÞ;
ð15Þ
where Y P (I)—total measured runoff, mm; k(I)—
coefficient taking into account the hydrographic
parameters of the basin.
Modeling the water balance of the river is realized in a computer program and is performed in two
stages. The first step is to configure the model for
known components of water and thermal balances
of the studied river. The first stage ends with plotting the calculated and measured runoff figures and
outputting the modeling error. The example of
modeling average annual runoff and its intra-annual
distribution is shown in Fig. 3.2.
The measured and calculated runoffs are very
close; therefore the model is correct. The
obtained model parameters were used for the
numerical experiment.
The second stage is a direct modeling the
water balance of the river using the parameters
18
A. A. Volchak and S. Parfomuk
þ for the
territory of Eastern Europe can be fairly accurately calculated using the dependence:
R
þ
C ¼ 1:17 Á R C þ 2:10; ðr ¼ 0:995 Æ 0:002Þ ð10Þ
For the months, a similar dependence is
offered:
R
þ
Mi ¼ 1:0 Á R M þ 0:77;
ð11Þ
(r = 0.985±0.002; F = 45.67 > F
T
215; 214; 1 %
ð
Þ
¼ 1:533).
Taking into account formula (10), the Eq. (9)
takes the form:
P
þ
C ¼ 6:65 À 0:07 Á R
þ
C
ð12Þ
The annual distribution of the positive component of turbulent warmth transfer (P) is as
following (Belonenko and Valuev 1974):
I
II
III
IV
V
VI
VII
VIII
IX
X
XI
XII
Year
12
12
9
7
6.5
5.5
6.5
6.5
6.5
7.5
10
11
100%
The changes in the warmth stocks of the active
layer of soil DB are significantly less than the values of radiation balance. For this calculation, there
are not always available data, so the calculation is
made approximately using the data tables of the
annual warmth exchange in the soil depending on
annual amplitudes of air temperature and warmth
transfer in the soil (Budyko 1971).
The winter climate in Belarus has a substantial
impact of the Atlantic Ocean, causing frequent and
prolonged thaws throughout the winter. In this
regard, the correction to the melting of snow and
frozen ground was distributed for the colder
months and is equally determined by following
equation (Marchuk 1982):
DE m ¼
L 1
L
Á 1:4 Á W CH þ W CP
ð
Þ ;
ð13Þ
where W CH ; W CP —the water reserves in snow
and frozen soil layer; L—latent warmth of melting
water.
The parameter n was determined using the
value of the maximum total evaporation under
optimal moistening of the active layer of soil.
Expressing the conditions of runoff formation
using the average slope of the basin area and the
coefficient of roughness, which in turn depends on
the hydraulic radius or average depth of runoff, one
can determine the parameter n (Mezentsev 1982).
The parameter n adopted differentiated both
within the territory and years and varied in the
range of 2.5–3.4. Analysis of data on runoff,
precipitation and maximum total evaporation for
the Neman River basin have shown the correctness of chosen parameter n.
The total humidity is defined as follows:
HðIÞ ¼ KXðIÞ þ W HB ðVðIÞ À VðI þ 1ÞÞ: ð14Þ
The solution of the equations system (1)–(4)
is carried out iteratively. During calculating the
initial value of the humidity is taken equal to the
value of the minimum humidity ratio of the soil,
i.e. Wð1Þ ¼ W HB , where Vð1Þ ¼ 1. The convergence of the solution method is achieved for the
fourth step of the calculation.
Adjustment of the calculated runoff is carried
out using coefficients that take into account the
influence of various factors on the formation of
the measured runoff, i.e.
Y P ðIÞ ¼ kðIÞ Á Y K ðIÞ;
ð15Þ
where Y P (I)—total measured runoff, mm; k(I)—
coefficient taking into account the hydrographic
parameters of the basin.
Modeling the water balance of the river is realized in a computer program and is performed in two
stages. The first step is to configure the model for
known components of water and thermal balances
of the studied river. The first stage ends with plotting the calculated and measured runoff figures and
outputting the modeling error. The example of
modeling average annual runoff and its intra-annual
distribution is shown in Fig. 3.2.
The measured and calculated runoffs are very
close; therefore the model is correct. The
obtained model parameters were used for the
numerical experiment.
The second stage is a direct modeling the
water balance of the river using the parameters
18
A. A. Volchak and S. Parfomuk