

(c) The calculated water elevations are propagated over the DEM elements by the 2D
cellular automaton.
The first proof of the algorithm concept was
carried out using the data from the flood event of
June 2013 in the Central Europe.
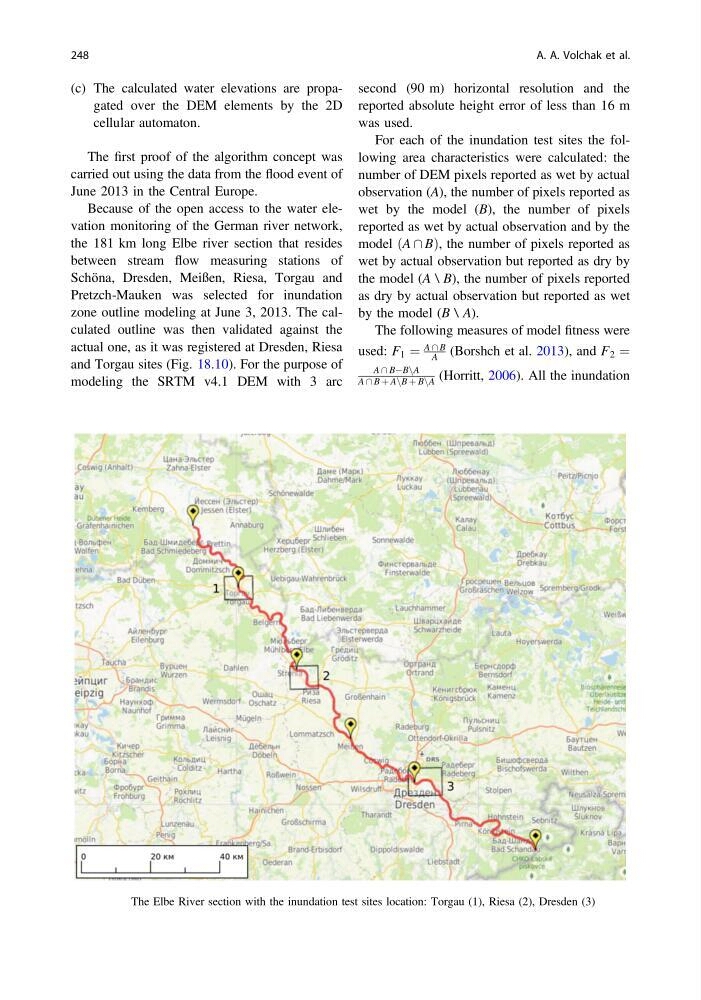
Because of the open access to the water elevation monitoring of the German river network,
the 181 km long Elbe river section that resides
between stream flow measuring stations of
Schöna, Dresden, Meißen, Riesa, Torgau and
Pretzch-Mauken was selected for inundation
zone outline modeling at June 3, 2013. The calculated outline was then validated against the
actual one, as it was registered at Dresden, Riesa
and Torgau sites (Fig. 18.10). For the purpose of
modeling the SRTM v4.1 DEM with 3 arc
second (90 m) horizontal resolution and the
reported absolute height error of less than 16 m
was used.
For each of the inundation test sites the following area characteristics were calculated: the
number of DEM pixels reported as wet by actual
observation (A), the number of pixels reported as
wet by the model (B), the number of pixels
reported as wet by actual observation and by the
model ðA \ BÞ, the number of pixels reported as
wet by actual observation but reported as dry by
the model (A \ B), the number of pixels reported
as dry by actual observation but reported as wet
by the model (B \ A).
The following measures of model fitness were
used: F 1 ¼
A \ B
A (Borshch et al. 2013), and F 2 ¼
A \ BÀBnA
A \ B þ AnB þ BnA (Horritt, 2006). All the inundation
Fig. 18.10 The Elbe River section with the inundation test sites location: Torgau (1), Riesa (2), Dresden (3)
248
A. A. Volchak et al.
cellular automaton.
The first proof of the algorithm concept was
carried out using the data from the flood event of
June 2013 in the Central Europe.
Because of the open access to the water elevation monitoring of the German river network,
the 181 km long Elbe river section that resides
between stream flow measuring stations of
Schöna, Dresden, Meißen, Riesa, Torgau and
Pretzch-Mauken was selected for inundation
zone outline modeling at June 3, 2013. The calculated outline was then validated against the
actual one, as it was registered at Dresden, Riesa
and Torgau sites (Fig. 18.10). For the purpose of
modeling the SRTM v4.1 DEM with 3 arc
second (90 m) horizontal resolution and the
reported absolute height error of less than 16 m
was used.
For each of the inundation test sites the following area characteristics were calculated: the
number of DEM pixels reported as wet by actual
observation (A), the number of pixels reported as
wet by the model (B), the number of pixels
reported as wet by actual observation and by the
model ðA \ BÞ, the number of pixels reported as
wet by actual observation but reported as dry by
the model (A \ B), the number of pixels reported
as dry by actual observation but reported as wet
by the model (B \ A).
The following measures of model fitness were
used: F 1 ¼
A \ B
A (Borshch et al. 2013), and F 2 ¼
A \ BÀBnA
A \ B þ AnB þ BnA (Horritt, 2006). All the inundation
Fig. 18.10 The Elbe River section with the inundation test sites location: Torgau (1), Riesa (2), Dresden (3)
248
A. A. Volchak et al.