

(Daniel 1978). The annual rainfall has a high
declining trend from 1950 to 1970s (Fig. 13.3).
During this period there were two severe (1951
and 1960) drought years (Chanda and Dhar
1976). A relatively dry period (deficit rainfall)
was also seen in earlier decades from 1923 to
1935 and during this period another two moderate droughts (1925 and 1927) occurred. The
annual rainfall in recent years from 1990 is
increased. On the other hand, the MK test was
employed on the annual rainfall series and the
results are presented in Table 13.2. Annual
rainfall showed a decreasing trend (b = −0.227)
on overall basis, although it was not statistically
significant. The decrease in annual rainfall magnitude varied between 0.22 and 0.33 mm per
annum.
13.4.3 Trends in Seasonal Rainfall
The seasons in BHB can be broadly classified as
pre-monsoon (March–May), monsoon (June–
October), post-monsoon (November–December)
and winter (January–February) (Table 13.2). It
was found that the pre-monsoon rainfall has
overall decreasing trend (b = 0.314) during the
study period analyzed from regression analysis.
However, the MK test suggests decreasing trends
and its magnitude is 0.24 (b) mm. The monsoon
rainfall has an overall increasing trend
(b = +0.317) in the last 100 years. Significant
increasing trend was also detected in southwest
monsoon rainfall over the entire BHB with the
help of MK test. The increase in magnitude was
0.409 mm/year. Similar results were obtained for
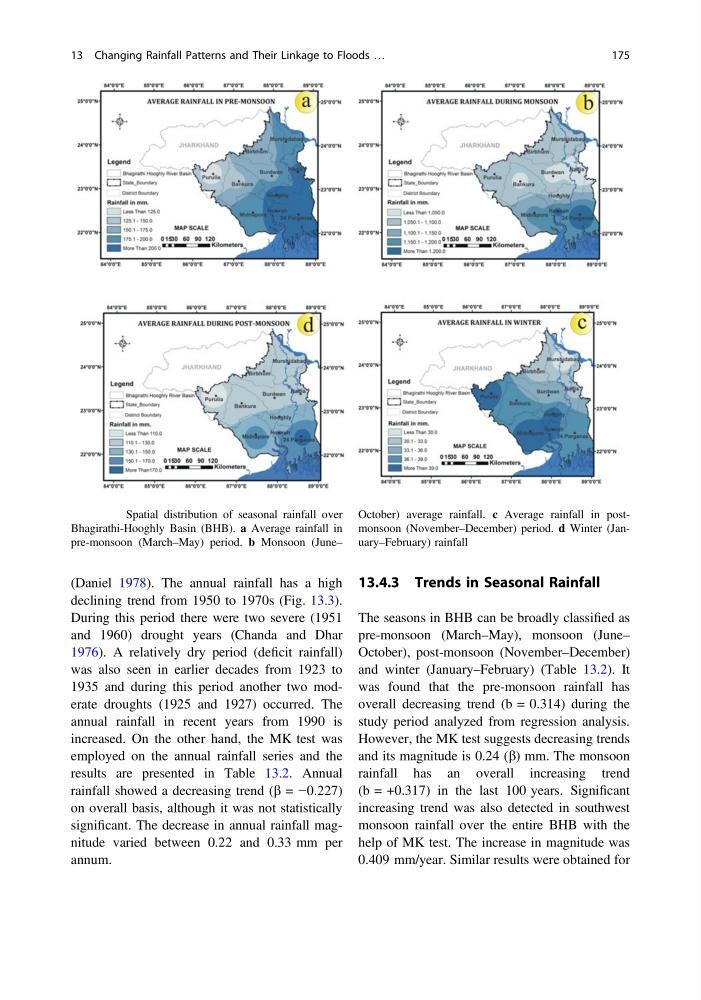
Fig. 13.2 Spatial distribution of seasonal rainfall over
Bhagirathi-Hooghly Basin (BHB). a Average rainfall in
pre-monsoon (March–May) period. b Monsoon (June–
October) average rainfall. c Average rainfall in postmonsoon (November–December) period. d Winter (January–February) rainfall
13 Changing Rainfall Patterns and Their Linkage to Floods …
175
declining trend from 1950 to 1970s (Fig. 13.3).
During this period there were two severe (1951
and 1960) drought years (Chanda and Dhar
1976). A relatively dry period (deficit rainfall)
was also seen in earlier decades from 1923 to
1935 and during this period another two moderate droughts (1925 and 1927) occurred. The
annual rainfall in recent years from 1990 is
increased. On the other hand, the MK test was
employed on the annual rainfall series and the
results are presented in Table 13.2. Annual
rainfall showed a decreasing trend (b = −0.227)
on overall basis, although it was not statistically
significant. The decrease in annual rainfall magnitude varied between 0.22 and 0.33 mm per
annum.
13.4.3 Trends in Seasonal Rainfall
The seasons in BHB can be broadly classified as
pre-monsoon (March–May), monsoon (June–
October), post-monsoon (November–December)
and winter (January–February) (Table 13.2). It
was found that the pre-monsoon rainfall has
overall decreasing trend (b = 0.314) during the
study period analyzed from regression analysis.
However, the MK test suggests decreasing trends
and its magnitude is 0.24 (b) mm. The monsoon
rainfall has an overall increasing trend
(b = +0.317) in the last 100 years. Significant
increasing trend was also detected in southwest
monsoon rainfall over the entire BHB with the
help of MK test. The increase in magnitude was
0.409 mm/year. Similar results were obtained for
Fig. 13.2 Spatial distribution of seasonal rainfall over
Bhagirathi-Hooghly Basin (BHB). a Average rainfall in
pre-monsoon (March–May) period. b Monsoon (June–
October) average rainfall. c Average rainfall in postmonsoon (November–December) period. d Winter (January–February) rainfall
13 Changing Rainfall Patterns and Their Linkage to Floods …
175