

Gangetic West Bengal by Kumar et al. (2010).
The rainfall during this season is high which
contributes to major floods across the basin. The
post-monsoon rainfall has an overall increasing
trend over the study period (0.079 mm/year) and
highly variable to the long-term normal. The
MK test indicates that the seasonal rainfall during the post-monsoon has shown an increasing
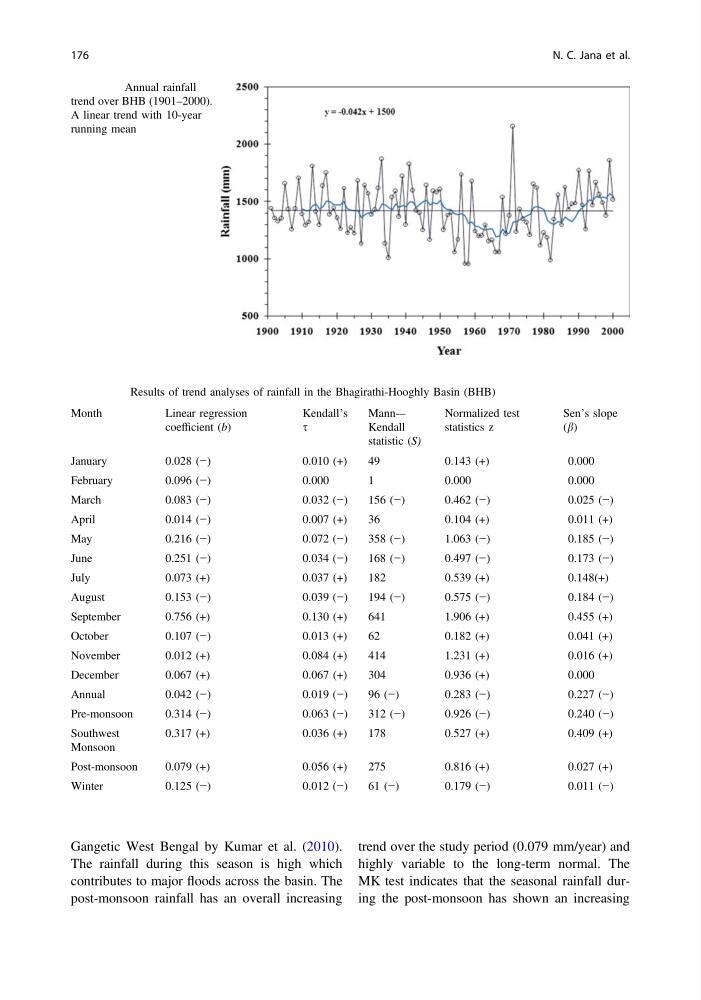
Fig. 13.3 Annual rainfall
trend over BHB (1901–2000).
A linear trend with 10-year
running mean
Table 13.2 Results of trend analyses of rainfall in the Bhagirathi-Hooghly Basin (BHB)
Month
Linear regression
coefficient (b)
Kendall’s
s
Mann-–
Kendall
statistic (S)
Normalized test
statistics z
Sen’s slope
(b)
January
0.028 (−)
0.010 (+)
49
0.143 (+)
0.000
February
0.096 (−)
0.000
1
0.000
0.000
March
0.083 (−)
0.032 (−)
156 (−)
0.462 (−)
0.025 (−)
April
0.014 (−)
0.007 (+)
36
0.104 (+)
0.011 (+)
May
0.216 (−)
0.072 (−)
358 (−)
1.063 (−)
0.185 (−)
June
0.251 (−)
0.034 (−)
168 (−)
0.497 (−)
0.173 (−)
July
0.073 (+)
0.037 (+)
182
0.539 (+)
0.148(+)
August
0.153 (−)
0.039 (−)
194 (−)
0.575 (−)
0.184 (−)
September
0.756 (+)
0.130 (+)
641
1.906 (+)
0.455 (+)
October
0.107 (−)
0.013 (+)
62
0.182 (+)
0.041 (+)
November
0.012 (+)
0.084 (+)
414
1.231 (+)
0.016 (+)
December
0.067 (+)
0.067 (+)
304
0.936 (+)
0.000
Annual
0.042 (−)
0.019 (−)
96 (−)
0.283 (−)
0.227 (−)
Pre-monsoon
0.314 (−)
0.063 (−)
312 (−)
0.926 (−)
0.240 (−)
Southwest
Monsoon
0.317 (+)
0.036 (+)
178
0.527 (+)
0.409 (+)
Post-monsoon
0.079 (+)
0.056 (+)
275
0.816 (+)
0.027 (+)
Winter
0.125 (−)
0.012 (−)
61 (−)
0.179 (−)
0.011 (−)
176
N. C. Jana et al.
The rainfall during this season is high which
contributes to major floods across the basin. The
post-monsoon rainfall has an overall increasing
trend over the study period (0.079 mm/year) and
highly variable to the long-term normal. The
MK test indicates that the seasonal rainfall during the post-monsoon has shown an increasing
Fig. 13.3 Annual rainfall
trend over BHB (1901–2000).
A linear trend with 10-year
running mean
Table 13.2 Results of trend analyses of rainfall in the Bhagirathi-Hooghly Basin (BHB)
Month
Linear regression
coefficient (b)
Kendall’s
s
Mann-–
Kendall
statistic (S)
Normalized test
statistics z
Sen’s slope
(b)
January
0.028 (−)
0.010 (+)
49
0.143 (+)
0.000
February
0.096 (−)
0.000
1
0.000
0.000
March
0.083 (−)
0.032 (−)
156 (−)
0.462 (−)
0.025 (−)
April
0.014 (−)
0.007 (+)
36
0.104 (+)
0.011 (+)
May
0.216 (−)
0.072 (−)
358 (−)
1.063 (−)
0.185 (−)
June
0.251 (−)
0.034 (−)
168 (−)
0.497 (−)
0.173 (−)
July
0.073 (+)
0.037 (+)
182
0.539 (+)
0.148(+)
August
0.153 (−)
0.039 (−)
194 (−)
0.575 (−)
0.184 (−)
September
0.756 (+)
0.130 (+)
641
1.906 (+)
0.455 (+)
October
0.107 (−)
0.013 (+)
62
0.182 (+)
0.041 (+)
November
0.012 (+)
0.084 (+)
414
1.231 (+)
0.016 (+)
December
0.067 (+)
0.067 (+)
304
0.936 (+)
0.000
Annual
0.042 (−)
0.019 (−)
96 (−)
0.283 (−)
0.227 (−)
Pre-monsoon
0.314 (−)
0.063 (−)
312 (−)
0.926 (−)
0.240 (−)
Southwest
Monsoon
0.317 (+)
0.036 (+)
178
0.527 (+)
0.409 (+)
Post-monsoon
0.079 (+)
0.056 (+)
275
0.816 (+)
0.027 (+)
Winter
0.125 (−)
0.012 (−)
61 (−)
0.179 (−)
0.011 (−)
176
N. C. Jana et al.