

to the presence of monsoon disturbances. The
southwest monsoon normally advances over the
basin and adjoining areas by around end of June
and establishes firmly over the entire region by
the middle of July. It withdraws from the region
by about second week of October comprising
80–150 days of rainy season with the normal
duration of 120 days. The basin receives heavy
to very heavy rainfall when different lowpressure systems like depressions, cyclonic
storms, and so on originating in the Bay of
Bengal, cross the Indian Coast and move in a
north to northeasterly direction. During the
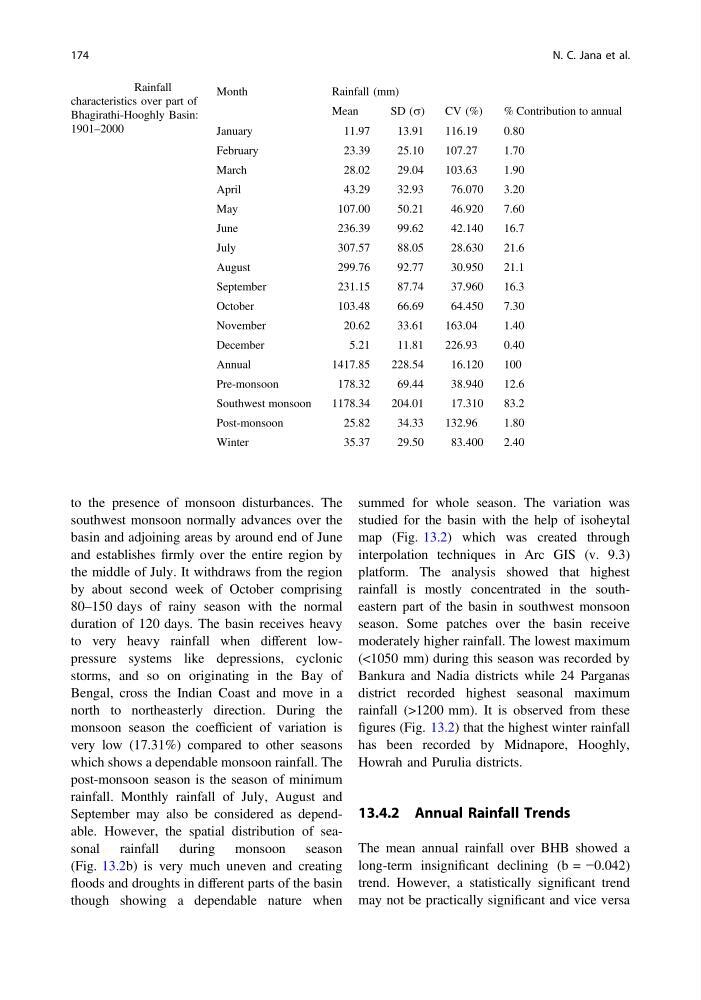
monsoon season the coefficient of variation is
very low (17.31%) compared to other seasons
which shows a dependable monsoon rainfall. The
post-monsoon season is the season of minimum
rainfall. Monthly rainfall of July, August and
September may also be considered as dependable. However, the spatial distribution of seasonal rainfall during monsoon season
(Fig. 13.2b) is very much uneven and creating
floods and droughts in different parts of the basin
though showing a dependable nature when
summed for whole season. The variation was
studied for the basin with the help of isoheytal
map (Fig. 13.2) which was created through
interpolation techniques in Arc GIS (v. 9.3)
platform. The analysis showed that highest
rainfall is mostly concentrated in the southeastern part of the basin in southwest monsoon
season. Some patches over the basin receive
moderately higher rainfall. The lowest maximum
(<1050 mm) during this season was recorded by
Bankura and Nadia districts while 24 Parganas
district recorded highest seasonal maximum
rainfall (>1200 mm). It is observed from these
figures (Fig. 13.2) that the highest winter rainfall
has been recorded by Midnapore, Hooghly,
Howrah and Purulia districts.
13.4.2 Annual Rainfall Trends
The mean annual rainfall over BHB showed a
long-term insignificant declining (b = −0.042)
trend. However, a statistically significant trend
may not be practically significant and vice versa
Table 13.1 Rainfall
characteristics over part of
Bhagirathi-Hooghly Basin:
1901–2000
Month
Rainfall (mm)
Mean
SD (r)
CV (%)
% Contribution to annual
January
11.97
13.91
116.19
0.80
February
23.39
25.10
107.27
1.70
March
28.02
29.04
103.63
1.90
April
43.29
32.93
76.070
3.20
May
107.00
50.21
46.920
7.60
June
236.39
99.62
42.140
16.7
July
307.57
88.05
28.630
21.6
August
299.76
92.77
30.950
21.1
September
231.15
87.74
37.960
16.3
October
103.48
66.69
64.450
7.30
November
20.62
33.61
163.04
1.40
December
5.21
11.81
226.93
0.40
Annual
1417.85
228.54
16.120
100
Pre-monsoon
178.32
69.44
38.940
12.6
Southwest monsoon
1178.34
204.01
17.310
83.2
Post-monsoon
25.82
34.33
132.96
1.80
Winter
35.37
29.50
83.400
2.40
174
N. C. Jana et al.
southwest monsoon normally advances over the
basin and adjoining areas by around end of June
and establishes firmly over the entire region by
the middle of July. It withdraws from the region
by about second week of October comprising
80–150 days of rainy season with the normal
duration of 120 days. The basin receives heavy
to very heavy rainfall when different lowpressure systems like depressions, cyclonic
storms, and so on originating in the Bay of
Bengal, cross the Indian Coast and move in a
north to northeasterly direction. During the
monsoon season the coefficient of variation is
very low (17.31%) compared to other seasons
which shows a dependable monsoon rainfall. The
post-monsoon season is the season of minimum
rainfall. Monthly rainfall of July, August and
September may also be considered as dependable. However, the spatial distribution of seasonal rainfall during monsoon season
(Fig. 13.2b) is very much uneven and creating
floods and droughts in different parts of the basin
though showing a dependable nature when
summed for whole season. The variation was
studied for the basin with the help of isoheytal
map (Fig. 13.2) which was created through
interpolation techniques in Arc GIS (v. 9.3)
platform. The analysis showed that highest
rainfall is mostly concentrated in the southeastern part of the basin in southwest monsoon
season. Some patches over the basin receive
moderately higher rainfall. The lowest maximum
(<1050 mm) during this season was recorded by
Bankura and Nadia districts while 24 Parganas
district recorded highest seasonal maximum
rainfall (>1200 mm). It is observed from these
figures (Fig. 13.2) that the highest winter rainfall
has been recorded by Midnapore, Hooghly,
Howrah and Purulia districts.
13.4.2 Annual Rainfall Trends
The mean annual rainfall over BHB showed a
long-term insignificant declining (b = −0.042)
trend. However, a statistically significant trend
may not be practically significant and vice versa
Table 13.1 Rainfall
characteristics over part of
Bhagirathi-Hooghly Basin:
1901–2000
Month
Rainfall (mm)
Mean
SD (r)
CV (%)
% Contribution to annual
January
11.97
13.91
116.19
0.80
February
23.39
25.10
107.27
1.70
March
28.02
29.04
103.63
1.90
April
43.29
32.93
76.070
3.20
May
107.00
50.21
46.920
7.60
June
236.39
99.62
42.140
16.7
July
307.57
88.05
28.630
21.6
August
299.76
92.77
30.950
21.1
September
231.15
87.74
37.960
16.3
October
103.48
66.69
64.450
7.30
November
20.62
33.61
163.04
1.40
December
5.21
11.81
226.93
0.40
Annual
1417.85
228.54
16.120
100
Pre-monsoon
178.32
69.44
38.940
12.6
Southwest monsoon
1178.34
204.01
17.310
83.2
Post-monsoon
25.82
34.33
132.96
1.80
Winter
35.37
29.50
83.400
2.40
174
N. C. Jana et al.