

388
CO 2 Emissions from Fossil Fuels, Land-Use Change, and Other
Factors
Global CO 2 emissions from burning fossil fuels and industrial activities increased at
an average of 3.1 ± 0.2 GtC/year per decade in the 1960s and by an average of
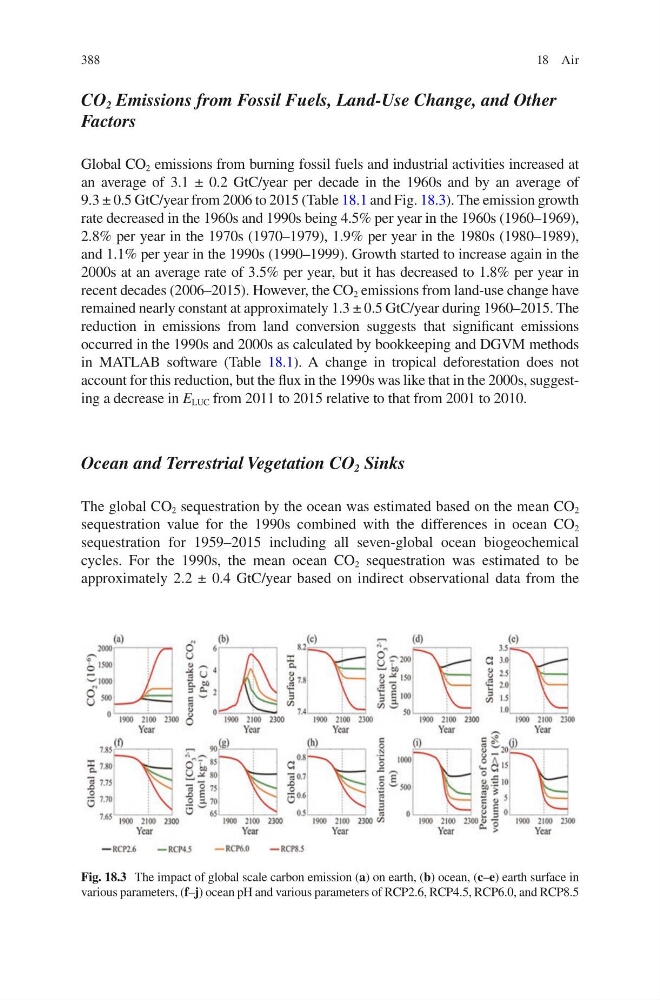
9.3 ± 0.5 GtC/year from 2006 to 2015 (Table 18.1 and Fig. 18.3). The emission growth
rate decreased in the 1960s and 1990s being 4.5% per year in the 1960s (1960–1969),
2.8% per year in the 1970s (1970–1979), 1.9% per year in the 1980s (1980–1989),
and 1.1% per year in the 1990s (1990–1999). Growth started to increase again in the
2000s at an average rate of 3.5% per year, but it has decreased to 1.8% per year in
recent decades (2006–2015). However, the CO 2 emissions from land-use change have
remained nearly constant at approximately 1.3 ± 0.5 GtC/year during 1960–2015. The
reduction in emissions from land conversion suggests that significant emissions
occurred in the 1990s and 2000s as calculated by bookkeeping and DGVM methods
in MATLAB software (Table 18.1). A change in tropical deforestation does not
account for this reduction, but the flux in the 1990s was like that in the 2000s, suggesting a decrease in E LUC from 2011 to 2015 relative to that from 2001 to 2010.
Ocean and Terrestrial Vegetation CO 2 Sinks
The global CO 2 sequestration by the ocean was estimated based on the mean CO 2
sequestration value for the 1990s combined with the differences in ocean CO 2
sequestration for 1959–2015 including all seven-global ocean biogeochemical
cycles. For the 1990s, the mean ocean CO 2 sequestration was estimated to be
approximately 2.2 ± 0.4 GtC/year based on indirect observational data from the
Fig. 18.3 The impact of global scale carbon emission (a) on earth, (b) ocean, (c–e) earth surface in
various parameters, (f–j) ocean pH and various parameters of RCP2.6, RCP4.5, RCP6.0, and RCP8.5
18 Air
CO 2 Emissions from Fossil Fuels, Land-Use Change, and Other
Factors
Global CO 2 emissions from burning fossil fuels and industrial activities increased at
an average of 3.1 ± 0.2 GtC/year per decade in the 1960s and by an average of
9.3 ± 0.5 GtC/year from 2006 to 2015 (Table 18.1 and Fig. 18.3). The emission growth
rate decreased in the 1960s and 1990s being 4.5% per year in the 1960s (1960–1969),
2.8% per year in the 1970s (1970–1979), 1.9% per year in the 1980s (1980–1989),
and 1.1% per year in the 1990s (1990–1999). Growth started to increase again in the
2000s at an average rate of 3.5% per year, but it has decreased to 1.8% per year in
recent decades (2006–2015). However, the CO 2 emissions from land-use change have
remained nearly constant at approximately 1.3 ± 0.5 GtC/year during 1960–2015. The
reduction in emissions from land conversion suggests that significant emissions
occurred in the 1990s and 2000s as calculated by bookkeeping and DGVM methods
in MATLAB software (Table 18.1). A change in tropical deforestation does not
account for this reduction, but the flux in the 1990s was like that in the 2000s, suggesting a decrease in E LUC from 2011 to 2015 relative to that from 2001 to 2010.
Ocean and Terrestrial Vegetation CO 2 Sinks
The global CO 2 sequestration by the ocean was estimated based on the mean CO 2
sequestration value for the 1990s combined with the differences in ocean CO 2
sequestration for 1959–2015 including all seven-global ocean biogeochemical
cycles. For the 1990s, the mean ocean CO 2 sequestration was estimated to be
approximately 2.2 ± 0.4 GtC/year based on indirect observational data from the
Fig. 18.3 The impact of global scale carbon emission (a) on earth, (b) ocean, (c–e) earth surface in
various parameters, (f–j) ocean pH and various parameters of RCP2.6, RCP4.5, RCP6.0, and RCP8.5
18 Air