

386
Results and Discussion
The average global carbon emissions from 1875 to 2016 have been estimated by
numerous scientists from NASA, NOAA, DEP, NASA, NOAA/ESRL, Scripps,
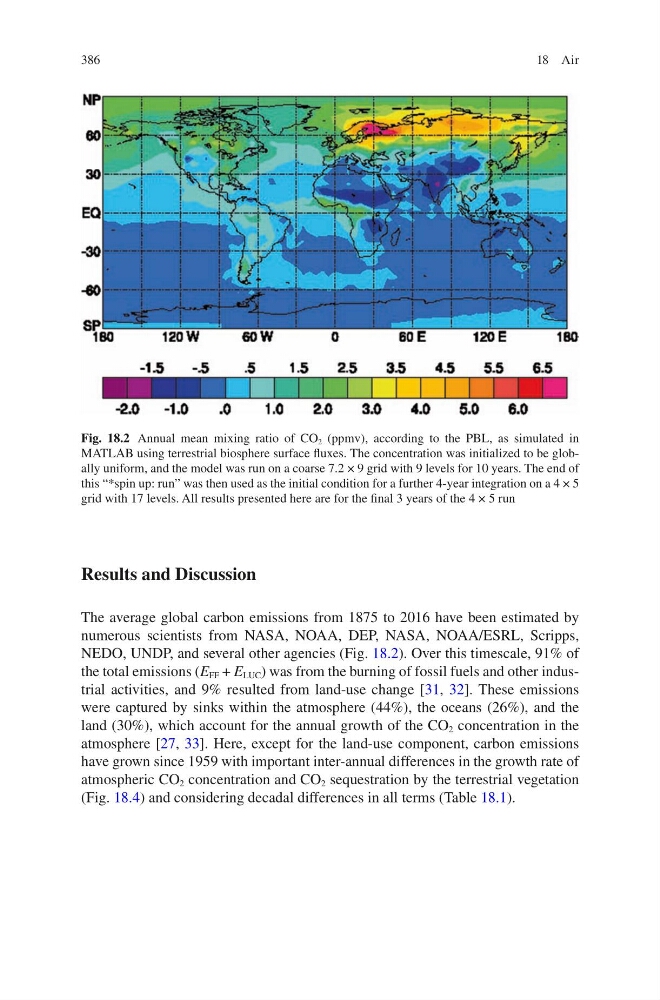
NEDO, UNDP, and several other agencies (Fig. 18.2). Over this timescale, 91% of
the total emissions (E FF + E LUC ) was from the burning of fossil fuels and other industrial activities, and 9% resulted from land-use change [31, 32]. These emissions
were captured by sinks within the atmosphere (44%), the oceans (26%), and the
land (30%), which account for the annual growth of the CO 2 concentration in the
atmosphere [27, 33]. Here, except for the land-use component, carbon emissions
have grown since 1959 with important inter-annual differences in the growth rate of
atmospheric CO 2 concentration and CO 2 sequestration by the terrestrial vegetation
(Fig. 18.4) and considering decadal differences in all terms (Table 18.1).
Fig. 18.2 Annual mean mixing ratio of CO 2 (ppmv), according to the PBL, as simulated in
MATLAB using terrestrial biosphere surface fluxes. The concentration was initialized to be globally uniform, and the model was run on a coarse 7.2 × 9 grid with 9 levels for 10 years. The end of
this “*spin up: run” was then used as the initial condition for a further 4-year integration on a 4 × 5
grid with 17 levels. All results presented here are for the final 3 years of the 4 × 5 run
18 Air
Results and Discussion
The average global carbon emissions from 1875 to 2016 have been estimated by
numerous scientists from NASA, NOAA, DEP, NASA, NOAA/ESRL, Scripps,
NEDO, UNDP, and several other agencies (Fig. 18.2). Over this timescale, 91% of
the total emissions (E FF + E LUC ) was from the burning of fossil fuels and other industrial activities, and 9% resulted from land-use change [31, 32]. These emissions
were captured by sinks within the atmosphere (44%), the oceans (26%), and the
land (30%), which account for the annual growth of the CO 2 concentration in the
atmosphere [27, 33]. Here, except for the land-use component, carbon emissions
have grown since 1959 with important inter-annual differences in the growth rate of
atmospheric CO 2 concentration and CO 2 sequestration by the terrestrial vegetation
(Fig. 18.4) and considering decadal differences in all terms (Table 18.1).
Fig. 18.2 Annual mean mixing ratio of CO 2 (ppmv), according to the PBL, as simulated in
MATLAB using terrestrial biosphere surface fluxes. The concentration was initialized to be globally uniform, and the model was run on a coarse 7.2 × 9 grid with 9 levels for 10 years. The end of
this “*spin up: run” was then used as the initial condition for a further 4-year integration on a 4 × 5
grid with 17 levels. All results presented here are for the final 3 years of the 4 × 5 run
18 Air