

294
model after having observed that the disinfection plots of natural algal–bacterial
systems were curvilinear, rather than typical log-linear type (Eq. 13.32). In the Hom
model, the bacterial inactivation level is predicted in a nonlinear function of C and
T, depending on the empirical parameters of n and m, respectively. Since this Hom
model is a two-parameter model, it should be stressed that the model is only applicable to a photo-disinfection profile with a maximum of two different nonlinear
regions. For m-value greater than unity, the inactivation curve displays an initial
“shoulder” while “tailing” is seen when the m-value is less than unity:
log
N
N
k C T
n m
o
= − ′
(13.32)
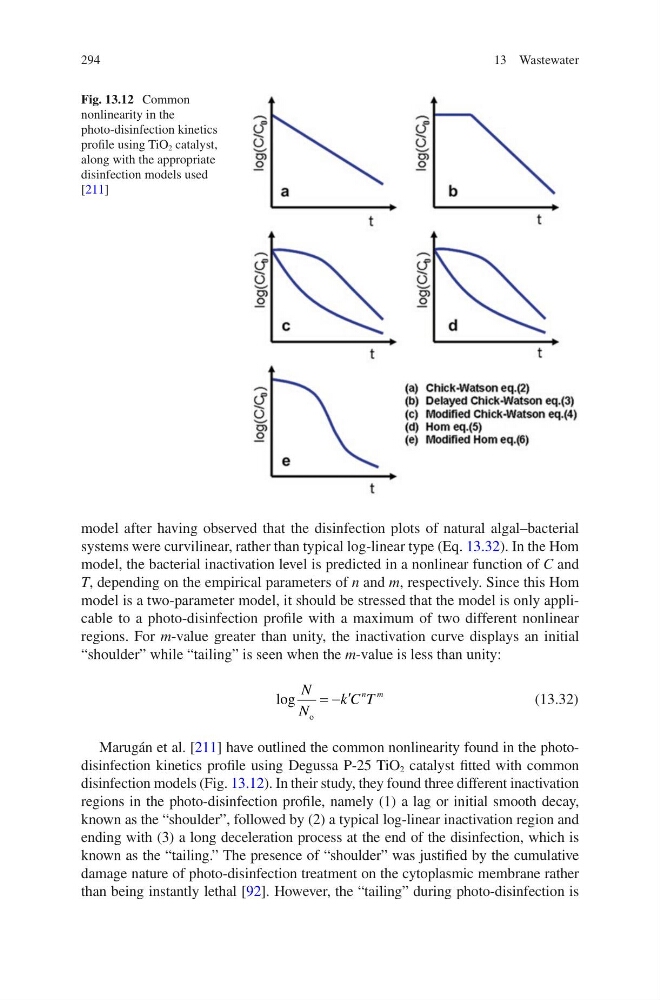
Marugán et al. [211] have outlined the common nonlinearity found in the photodisinfection kinetics profile using Degussa P-25 TiO 2 catalyst fitted with common
disinfection models (Fig. 13.12). In their study, they found three different inactivation
regions in the photo-disinfection profile, namely (1) a lag or initial smooth decay,
known as the “shoulder”, followed by (2) a typical log-linear inactivation region and
ending with (3) a long deceleration process at the end of the disinfection, which is
known as the “tailing.” The presence of “shoulder” was justified by the cumulative
damage nature of photo-disinfection treatment on the cytoplasmic membrane rather
than being instantly lethal [92]. However, the “tailing” during photo- disinfection is
Fig. 13.12 Common
nonlinearity in the
photo-disinfection kinetics
profile using TiO 2 catalyst,
along with the appropriate
disinfection models used
[211]
13 Wastewater
model after having observed that the disinfection plots of natural algal–bacterial
systems were curvilinear, rather than typical log-linear type (Eq. 13.32). In the Hom
model, the bacterial inactivation level is predicted in a nonlinear function of C and
T, depending on the empirical parameters of n and m, respectively. Since this Hom
model is a two-parameter model, it should be stressed that the model is only applicable to a photo-disinfection profile with a maximum of two different nonlinear
regions. For m-value greater than unity, the inactivation curve displays an initial
“shoulder” while “tailing” is seen when the m-value is less than unity:
log
N
N
k C T
n m
o
= − ′
(13.32)
Marugán et al. [211] have outlined the common nonlinearity found in the photodisinfection kinetics profile using Degussa P-25 TiO 2 catalyst fitted with common
disinfection models (Fig. 13.12). In their study, they found three different inactivation
regions in the photo-disinfection profile, namely (1) a lag or initial smooth decay,
known as the “shoulder”, followed by (2) a typical log-linear inactivation region and
ending with (3) a long deceleration process at the end of the disinfection, which is
known as the “tailing.” The presence of “shoulder” was justified by the cumulative
damage nature of photo-disinfection treatment on the cytoplasmic membrane rather
than being instantly lethal [92]. However, the “tailing” during photo- disinfection is
Fig. 13.12 Common
nonlinearity in the
photo-disinfection kinetics
profile using TiO 2 catalyst,
along with the appropriate
disinfection models used
[211]
13 Wastewater