

293
r TOC O
TOC
TOC
, =
[ ]
+ [ ]
β
β β
1
2
3
(13.29)
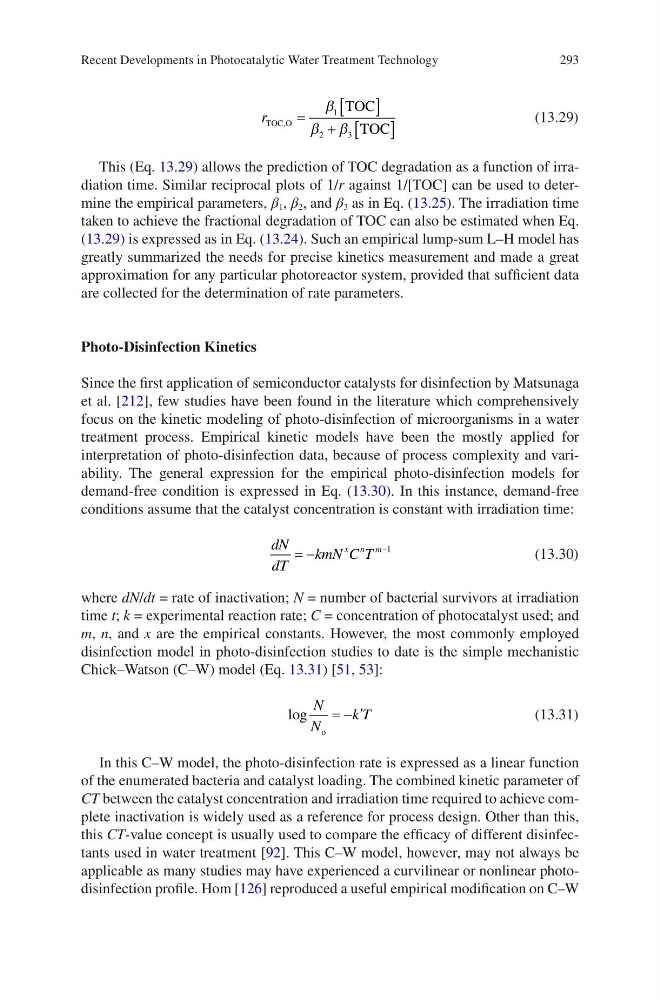
This (Eq. 13.29) allows the prediction of TOC degradation as a function of irradiation time. Similar reciprocal plots of 1/r against 1/[TOC] can be used to determine the empirical parameters, β 1 , β 2 , and β 3 as in Eq. (13.25). The irradiation time
taken to achieve the fractional degradation of TOC can also be estimated when Eq.
(13.29) is expressed as in Eq. (13.24). Such an empirical lump-sum L–H model has
greatly summarized the needs for precise kinetics measurement and made a great
approximation for any particular photoreactor system, provided that sufficient data
are collected for the determination of rate parameters.
Photo-Disinfection Kinetics
Since the first application of semiconductor catalysts for disinfection by Matsunaga
et al. [212], few studies have been found in the literature which comprehensively
focus on the kinetic modeling of photo-disinfection of microorganisms in a water
treatment process. Empirical kinetic models have been the mostly applied for
interpretation of photo-disinfection data, because of process complexity and variability. The general expression for the empirical photo-disinfection models for
demand- free condition is expressed in Eq. (13.30). In this instance, demand-free
conditions assume that the catalyst concentration is constant with irradiation time:
dN
dT
kmN C T
x n m
= −
−1
(13.30)
where dN/dt = rate of inactivation; N = number of bacterial survivors at irradiation
time t; k = experimental reaction rate; C = concentration of photocatalyst used; and
m, n, and x are the empirical constants. However, the most commonly employed
disinfection model in photo-disinfection studies to date is the simple mechanistic
Chick–Watson (C–W) model (Eq. 13.31) [51, 53]:
log
N
N
k T
o
= − ′
(13.31)
In this C–W model, the photo-disinfection rate is expressed as a linear function
of the enumerated bacteria and catalyst loading. The combined kinetic parameter of
CT between the catalyst concentration and irradiation time required to achieve complete inactivation is widely used as a reference for process design. Other than this,
this CT-value concept is usually used to compare the efficacy of different disinfectants used in water treatment [92]. This C–W model, however, may not always be
applicable as many studies may have experienced a curvilinear or nonlinear photodisinfection profile. Hom [126] reproduced a useful empirical modification on C–W
Recent Developments in Photocatalytic Water Treatment Technology
r TOC O
TOC
TOC
, =
[ ]
+ [ ]
β
β β
1
2
3
(13.29)
This (Eq. 13.29) allows the prediction of TOC degradation as a function of irradiation time. Similar reciprocal plots of 1/r against 1/[TOC] can be used to determine the empirical parameters, β 1 , β 2 , and β 3 as in Eq. (13.25). The irradiation time
taken to achieve the fractional degradation of TOC can also be estimated when Eq.
(13.29) is expressed as in Eq. (13.24). Such an empirical lump-sum L–H model has
greatly summarized the needs for precise kinetics measurement and made a great
approximation for any particular photoreactor system, provided that sufficient data
are collected for the determination of rate parameters.
Photo-Disinfection Kinetics
Since the first application of semiconductor catalysts for disinfection by Matsunaga
et al. [212], few studies have been found in the literature which comprehensively
focus on the kinetic modeling of photo-disinfection of microorganisms in a water
treatment process. Empirical kinetic models have been the mostly applied for
interpretation of photo-disinfection data, because of process complexity and variability. The general expression for the empirical photo-disinfection models for
demand- free condition is expressed in Eq. (13.30). In this instance, demand-free
conditions assume that the catalyst concentration is constant with irradiation time:
dN
dT
kmN C T
x n m
= −
−1
(13.30)
where dN/dt = rate of inactivation; N = number of bacterial survivors at irradiation
time t; k = experimental reaction rate; C = concentration of photocatalyst used; and
m, n, and x are the empirical constants. However, the most commonly employed
disinfection model in photo-disinfection studies to date is the simple mechanistic
Chick–Watson (C–W) model (Eq. 13.31) [51, 53]:
log
N
N
k T
o
= − ′
(13.31)
In this C–W model, the photo-disinfection rate is expressed as a linear function
of the enumerated bacteria and catalyst loading. The combined kinetic parameter of
CT between the catalyst concentration and irradiation time required to achieve complete inactivation is widely used as a reference for process design. Other than this,
this CT-value concept is usually used to compare the efficacy of different disinfectants used in water treatment [92]. This C–W model, however, may not always be
applicable as many studies may have experienced a curvilinear or nonlinear photodisinfection profile. Hom [126] reproduced a useful empirical modification on C–W
Recent Developments in Photocatalytic Water Treatment Technology