

292
Rearranging and integration of Eq. (13.26) yield the typical pseudo-first-order
model as in Eqs. (13.27) and (13.28):
C C
k t
=
− ′
0 e
(13.27)
ln
C
C
k Kt
kt
0
= −
= − ′
r
(13.28)
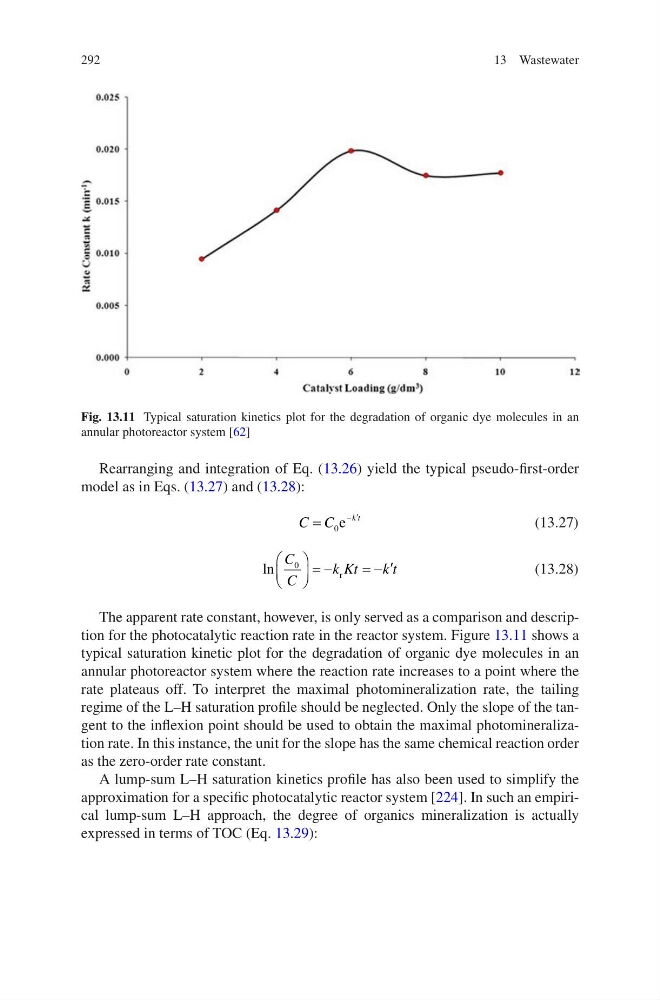
The apparent rate constant, however, is only served as a comparison and description for the photocatalytic reaction rate in the reactor system. Figure 13.11 shows a
typical saturation kinetic plot for the degradation of organic dye molecules in an
annular photoreactor system where the reaction rate increases to a point where the
rate plateaus off. To interpret the maximal photomineralization rate, the tailing
regime of the L–H saturation profile should be neglected. Only the slope of the tangent to the inflexion point should be used to obtain the maximal photomineralization rate. In this instance, the unit for the slope has the same chemical reaction order
as the zero-order rate constant.
A lump-sum L–H saturation kinetics profile has also been used to simplify the
approximation for a specific photocatalytic reactor system [224]. In such an empirical lump-sum L–H approach, the degree of organics mineralization is actually
expressed in terms of TOC (Eq. 13.29):
Fig. 13.11 Typical saturation kinetics plot for the degradation of organic dye molecules in an
annular photoreactor system [62]
13 Wastewater
Rearranging and integration of Eq. (13.26) yield the typical pseudo-first-order
model as in Eqs. (13.27) and (13.28):
C C
k t
=
− ′
0 e
(13.27)
ln
C
C
k Kt
kt
0
= −
= − ′
r
(13.28)
The apparent rate constant, however, is only served as a comparison and description for the photocatalytic reaction rate in the reactor system. Figure 13.11 shows a
typical saturation kinetic plot for the degradation of organic dye molecules in an
annular photoreactor system where the reaction rate increases to a point where the
rate plateaus off. To interpret the maximal photomineralization rate, the tailing
regime of the L–H saturation profile should be neglected. Only the slope of the tangent to the inflexion point should be used to obtain the maximal photomineralization rate. In this instance, the unit for the slope has the same chemical reaction order
as the zero-order rate constant.
A lump-sum L–H saturation kinetics profile has also been used to simplify the
approximation for a specific photocatalytic reactor system [224]. In such an empirical lump-sum L–H approach, the degree of organics mineralization is actually
expressed in terms of TOC (Eq. 13.29):
Fig. 13.11 Typical saturation kinetics plot for the degradation of organic dye molecules in an
annular photoreactor system [62]
13 Wastewater