

122
I Lmo = I L . Thus, the mode of I mo –V mo relationship for the N s series of connected cells
can be expressed by
V
I N R N K
I I
I
I
mo
mo S S
S
L
m o
o
o
§
©
¨
·
¹
¸
log
(6.44)
Naturally, the current–voltage relationship can be further modified considering
all parallel connections in N P cells in all parallel modes and can be described as
follows [9, 21]:
V
I
R
N
K
N I I
N I
N I
mo
mo
s
p
sh L
m o
p o
p o
§
©
¨ ¨
·
¹
¸ ¸
log
(6.45)
Since the photon-induced current primarily depends on the solar radiation and
optimum temperature configuration of the PV cell, the current dynamic is calculated as
I
G I
K T T
V
L
S C
I
c
r ef
mo
ª ¬
º ¼ u
(6.46)
where I sc denotes the PV current at 25 °C and KW/m
2
, K I denotes the acting PV
panel coefficient factor, T ref denotes the PV panel’s optimum temperature, and G
denotes the solar energy in mW/m
2
[44, 53].
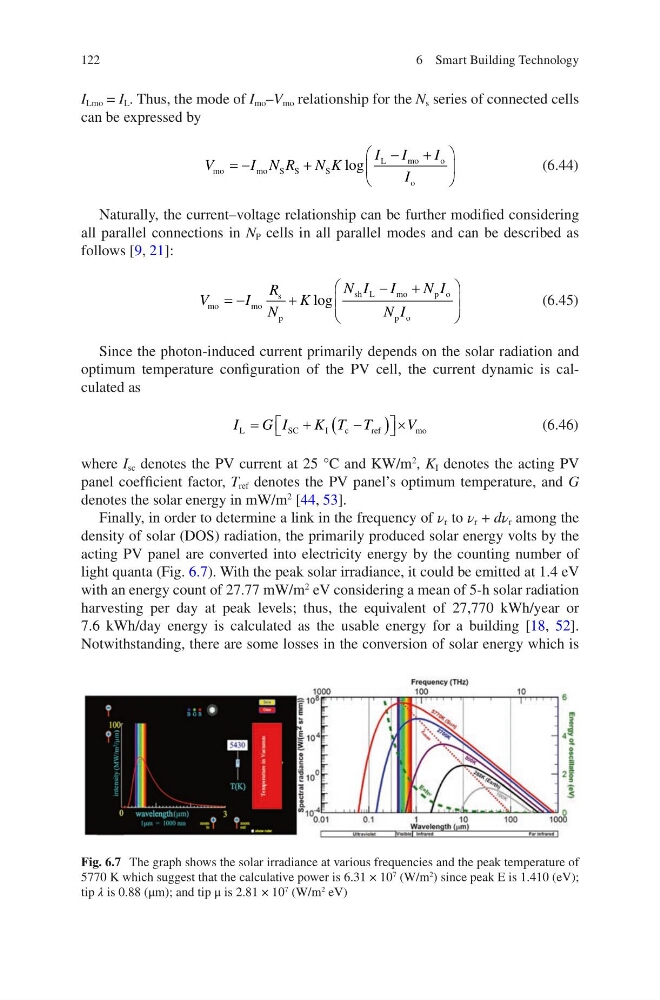
Finally, in order to determine a link in the frequency of ν r to ν r + dν r among the
density of solar (DOS) radiation, the primarily produced solar energy volts by the
acting PV panel are converted into electricity energy by the counting number of
light quanta (Fig. 6.7). With the peak solar irradiance, it could be emitted at 1.4 eV
with an energy count of 27.77 mW/m
2
eV considering a mean of 5-h solar radiation
harvesting per day at peak levels; thus, the equivalent of 27,770 kWh/year or
7.6 kWh/day energy is calculated as the usable energy for a building [18, 52].
Notwithstanding, there are some losses in the conversion of solar energy which is
Fig. 6.7 The graph shows the solar irradiance at various frequencies and the peak temperature of
5770 K which suggest that the calculative power is 6.31 × 10
7 (W/m
2
) since peak E is 1.410 (eV);
tip λ is 0.88 (μm); and tip μ is 2.81 × 10
7 (W/m
2 eV)
6 Smart Building Technology
I Lmo = I L . Thus, the mode of I mo –V mo relationship for the N s series of connected cells
can be expressed by
V
I N R N K
I I
I
I
mo
mo S S
S
L
m o
o
o
§
©
¨
·
¹
¸
log
(6.44)
Naturally, the current–voltage relationship can be further modified considering
all parallel connections in N P cells in all parallel modes and can be described as
follows [9, 21]:
V
I
R
N
K
N I I
N I
N I
mo
mo
s
p
sh L
m o
p o
p o
§
©
¨ ¨
·
¹
¸ ¸
log
(6.45)
Since the photon-induced current primarily depends on the solar radiation and
optimum temperature configuration of the PV cell, the current dynamic is calculated as
I
G I
K T T
V
L
S C
I
c
r ef
mo
ª ¬
º ¼ u
(6.46)
where I sc denotes the PV current at 25 °C and KW/m
2
, K I denotes the acting PV
panel coefficient factor, T ref denotes the PV panel’s optimum temperature, and G
denotes the solar energy in mW/m
2
[44, 53].
Finally, in order to determine a link in the frequency of ν r to ν r + dν r among the
density of solar (DOS) radiation, the primarily produced solar energy volts by the
acting PV panel are converted into electricity energy by the counting number of
light quanta (Fig. 6.7). With the peak solar irradiance, it could be emitted at 1.4 eV
with an energy count of 27.77 mW/m
2
eV considering a mean of 5-h solar radiation
harvesting per day at peak levels; thus, the equivalent of 27,770 kWh/year or
7.6 kWh/day energy is calculated as the usable energy for a building [18, 52].
Notwithstanding, there are some losses in the conversion of solar energy which is
Fig. 6.7 The graph shows the solar irradiance at various frequencies and the peak temperature of
5770 K which suggest that the calculative power is 6.31 × 10
7 (W/m
2
) since peak E is 1.410 (eV);
tip λ is 0.88 (μm); and tip μ is 2.81 × 10
7 (W/m
2 eV)
6 Smart Building Technology