

7.2 Fundamentals of Nano-Indentation
183
max
s
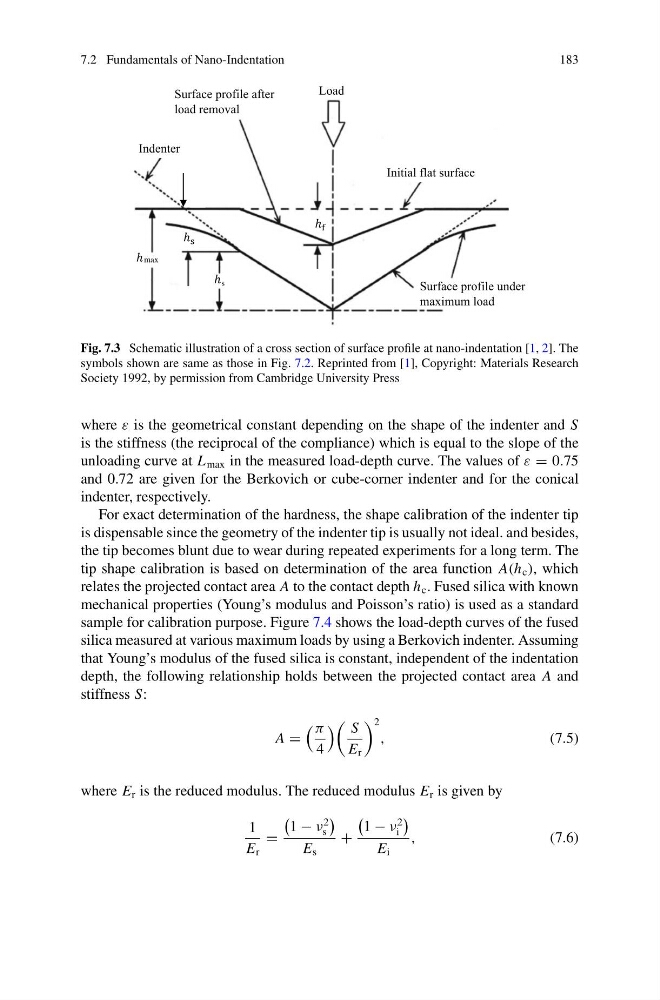
Fig. 7.3 Schematic illustration of a cross section of surface profile at nano-indentation [1, 2]. The
symbols shown are same as those in Fig. 7.2. Reprinted from [1], Copyright: Materials Research
Society 1992, by permission from Cambridge University Press
where ε is the geometrical constant depending on the shape of the indenter and S
is the stiffness (the reciprocal of the compliance) which is equal to the slope of the
unloading curve at L max in the measured load-depth curve. The values of ε = 0.75
and 0.72 are given for the Berkovich or cube-corner indenter and for the conical
indenter, respectively.
For exact determination of the hardness, the shape calibration of the indenter tip
is dispensable since the geometry of the indenter tip is usually not ideal. and besides,
the tip becomes blunt due to wear during repeated experiments for a long term. The
tip shape calibration is based on determination of the area function A(h c ), which
relates the projected contact area A to the contact depth h c . Fused silica with known
mechanical properties (Young’s modulus and Poisson’s ratio) is used as a standard
sample for calibration purpose. Figure 7.4 shows the load-depth curves of the fused
silica measured at various maximum loads by using a Berkovich indenter. Assuming
that Young’s modulus of the fused silica is constant, independent of the indentation
depth, the following relationship holds between the projected contact area A and
stiffness S:
A =
π
4
S
E r
2
,
(7.5)
where E r is the reduced modulus. The reduced modulus E r is given by
1
E r
=
1 − ν
2
s
E s
+
1 − ν
2
i
E i
,
(7.6)
183
max
s
Fig. 7.3 Schematic illustration of a cross section of surface profile at nano-indentation [1, 2]. The
symbols shown are same as those in Fig. 7.2. Reprinted from [1], Copyright: Materials Research
Society 1992, by permission from Cambridge University Press
where ε is the geometrical constant depending on the shape of the indenter and S
is the stiffness (the reciprocal of the compliance) which is equal to the slope of the
unloading curve at L max in the measured load-depth curve. The values of ε = 0.75
and 0.72 are given for the Berkovich or cube-corner indenter and for the conical
indenter, respectively.
For exact determination of the hardness, the shape calibration of the indenter tip
is dispensable since the geometry of the indenter tip is usually not ideal. and besides,
the tip becomes blunt due to wear during repeated experiments for a long term. The
tip shape calibration is based on determination of the area function A(h c ), which
relates the projected contact area A to the contact depth h c . Fused silica with known
mechanical properties (Young’s modulus and Poisson’s ratio) is used as a standard
sample for calibration purpose. Figure 7.4 shows the load-depth curves of the fused
silica measured at various maximum loads by using a Berkovich indenter. Assuming
that Young’s modulus of the fused silica is constant, independent of the indentation
depth, the following relationship holds between the projected contact area A and
stiffness S:
A =
π
4
S
E r
2
,
(7.5)
where E r is the reduced modulus. The reduced modulus E r is given by
1
E r
=
1 − ν
2
s
E s
+
1 − ν
2
i
E i
,
(7.6)