

182
7 Nano-Mechanical Properties of Solid Surfaces Obtained …
Load,
L
Depth, h
L max
h max
h f
h c
S
Loading
Unloading
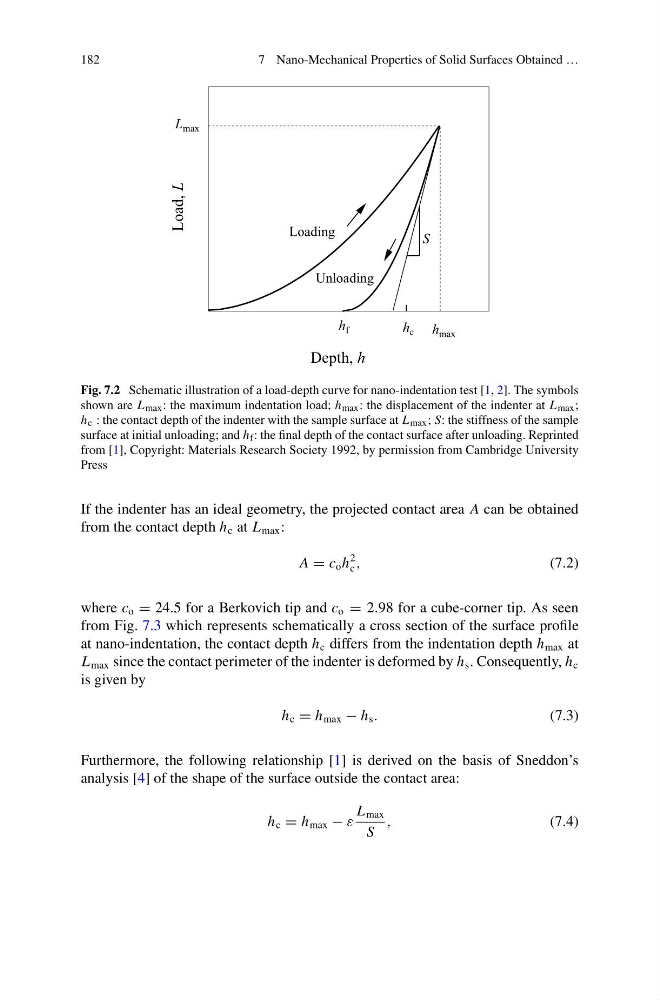
Fig. 7.2 Schematic illustration of a load-depth curve for nano-indentation test [1, 2]. The symbols
shown are L max : the maximum indentation load; h max : the displacement of the indenter at L max ;
h c : the contact depth of the indenter with the sample surface at L max ; S: the stiffness of the sample
surface at initial unloading; and h f : the final depth of the contact surface after unloading. Reprinted
from [1], Copyright: Materials Research Society 1992, by permission from Cambridge University
Press
If the indenter has an ideal geometry, the projected contact area A can be obtained
from the contact depth h c at L max :
A = c o h
2
c ,
(7.2)
where c o = 24.5 for a Berkovich tip and c o = 2.98 for a cube-corner tip. As seen
from Fig. 7.3 which represents schematically a cross section of the surface profile
at nano-indentation, the contact depth h c differs from the indentation depth h max at
L max since the contact perimeter of the indenter is deformed by h s . Consequently, h c
is given by
h c = h max − h s .
(7.3)
Furthermore, the following relationship [1] is derived on the basis of Sneddon’s
analysis [4] of the shape of the surface outside the contact area:
h c = h max − ε
L max
S
,
(7.4)
7 Nano-Mechanical Properties of Solid Surfaces Obtained …
Load,
L
Depth, h
L max
h max
h f
h c
S
Loading
Unloading
Fig. 7.2 Schematic illustration of a load-depth curve for nano-indentation test [1, 2]. The symbols
shown are L max : the maximum indentation load; h max : the displacement of the indenter at L max ;
h c : the contact depth of the indenter with the sample surface at L max ; S: the stiffness of the sample
surface at initial unloading; and h f : the final depth of the contact surface after unloading. Reprinted
from [1], Copyright: Materials Research Society 1992, by permission from Cambridge University
Press
If the indenter has an ideal geometry, the projected contact area A can be obtained
from the contact depth h c at L max :
A = c o h
2
c ,
(7.2)
where c o = 24.5 for a Berkovich tip and c o = 2.98 for a cube-corner tip. As seen
from Fig. 7.3 which represents schematically a cross section of the surface profile
at nano-indentation, the contact depth h c differs from the indentation depth h max at
L max since the contact perimeter of the indenter is deformed by h s . Consequently, h c
is given by
h c = h max − h s .
(7.3)
Furthermore, the following relationship [1] is derived on the basis of Sneddon’s
analysis [4] of the shape of the surface outside the contact area:
h c = h max − ε
L max
S
,
(7.4)