

106
4 Changes in Surface Stress Associated with Underpotential …
where UPD (θ M → 0) is the UPD potential window at θ M → 0 which is different
from UPD at θ M ≈ 0.5 in Eq. (4.1) or Eq. (4.2). The value of UPD (θ M → 0) is
equal to that obtained by adding half width δ of the peak at E
a
M,s to UPD (θ M ≈ 0.5)
in Fig. 4.1:
UPD (θ M → 0) = UPD (θ M ≈ 0.5) + δ.
(4.6)
Trasatti [5] showed that the linear relationship with unity slope holds between
UPD (θ M → 0) obtained experimentally by Eq. (4.6) and Φ M
− Φ M for various
UPD systems, proving the validity of Eq. (4.5). Equation (4.5) suggests that the
surface bond between M and M
is almost ionic at θ M → 0, which is in similar
manner to the initial stage of alkali metal adsorption on jellium metal surface from
the gas phase [7].
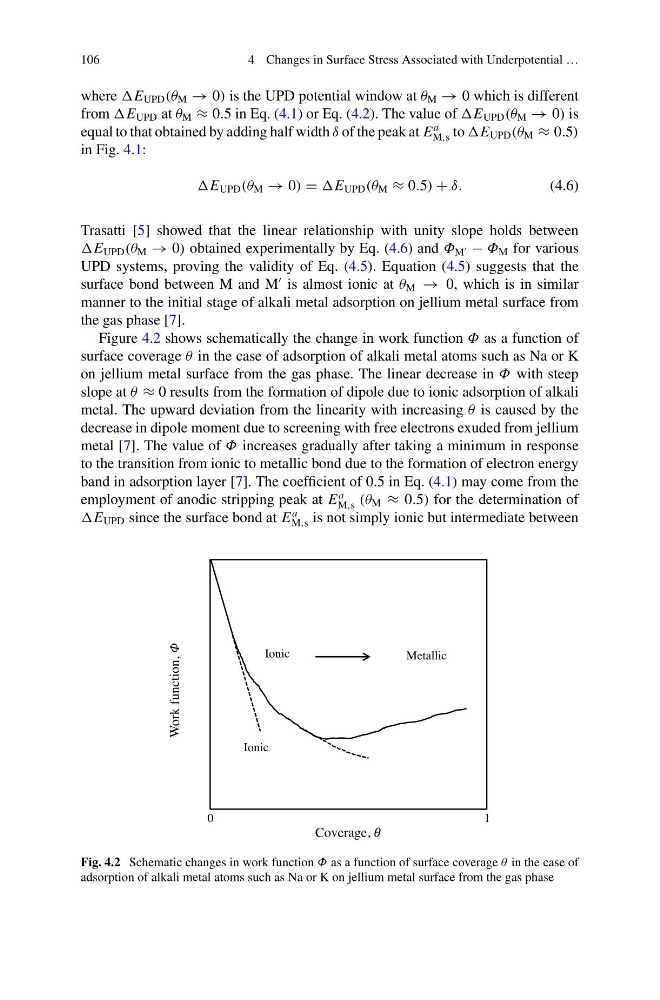
Figure 4.2 shows schematically the change in work function Φ as a function of
surface coverage θ in the case of adsorption of alkali metal atoms such as Na or K
on jellium metal surface from the gas phase. The linear decrease in Φ with steep
slope at θ ≈ 0 results from the formation of dipole due to ionic adsorption of alkali
metal. The upward deviation from the linearity with increasing θ is caused by the
decrease in dipole moment due to screening with free electrons exuded from jellium
metal [7]. The value of Φ increases gradually after taking a minimum in response
to the transition from ionic to metallic bond due to the formation of electron energy
band in adsorption layer [7]. The coefficient of 0.5 in Eq. (4.1) may come from the
employment of anodic stripping peak at E
a
M,s (θ M ≈ 0.5) for the determination of
UPD since the surface bond at E
a
M,s is not simply ionic but intermediate between
Fig. 4.2 Schematic changes in work function Φ as a function of surface coverage θ in the case of
adsorption of alkali metal atoms such as Na or K on jellium metal surface from the gas phase
4 Changes in Surface Stress Associated with Underpotential …
where UPD (θ M → 0) is the UPD potential window at θ M → 0 which is different
from UPD at θ M ≈ 0.5 in Eq. (4.1) or Eq. (4.2). The value of UPD (θ M → 0) is
equal to that obtained by adding half width δ of the peak at E
a
M,s to UPD (θ M ≈ 0.5)
in Fig. 4.1:
UPD (θ M → 0) = UPD (θ M ≈ 0.5) + δ.
(4.6)
Trasatti [5] showed that the linear relationship with unity slope holds between
UPD (θ M → 0) obtained experimentally by Eq. (4.6) and Φ M
− Φ M for various
UPD systems, proving the validity of Eq. (4.5). Equation (4.5) suggests that the
surface bond between M and M
is almost ionic at θ M → 0, which is in similar
manner to the initial stage of alkali metal adsorption on jellium metal surface from
the gas phase [7].
Figure 4.2 shows schematically the change in work function Φ as a function of
surface coverage θ in the case of adsorption of alkali metal atoms such as Na or K
on jellium metal surface from the gas phase. The linear decrease in Φ with steep
slope at θ ≈ 0 results from the formation of dipole due to ionic adsorption of alkali
metal. The upward deviation from the linearity with increasing θ is caused by the
decrease in dipole moment due to screening with free electrons exuded from jellium
metal [7]. The value of Φ increases gradually after taking a minimum in response
to the transition from ionic to metallic bond due to the formation of electron energy
band in adsorption layer [7]. The coefficient of 0.5 in Eq. (4.1) may come from the
employment of anodic stripping peak at E
a
M,s (θ M ≈ 0.5) for the determination of
UPD since the surface bond at E
a
M,s is not simply ionic but intermediate between
Fig. 4.2 Schematic changes in work function Φ as a function of surface coverage θ in the case of
adsorption of alkali metal atoms such as Na or K on jellium metal surface from the gas phase