

281
(10–20%), acetate esters, acetone (below 5%) and some other minor admixtures.
Each of these components can potentially be identified by GC but the corresponding
experimental procedures differ from those used for identification of the alcohols.
Therefore, it should be clarified how can these solvents manifest themselves in the
samples during the alcohols identification and, in case any components actually
provide some GC responses, which of them do they correspond to?
In order to clarify this issue, the regular mixture of eight alcohols (from methanol
to amyl alcohol) has been used to obtain the reference chromatogram and then some
amount of each solvent was added to the mixture. The chromatograms obtained
after ‘poisoning’ of the mixture with the solvents has been compared with the reference one for identification of changes and/or extra peaks present at the former
records.
No extra peaks appeared in the chromatograms but some obvious changes were
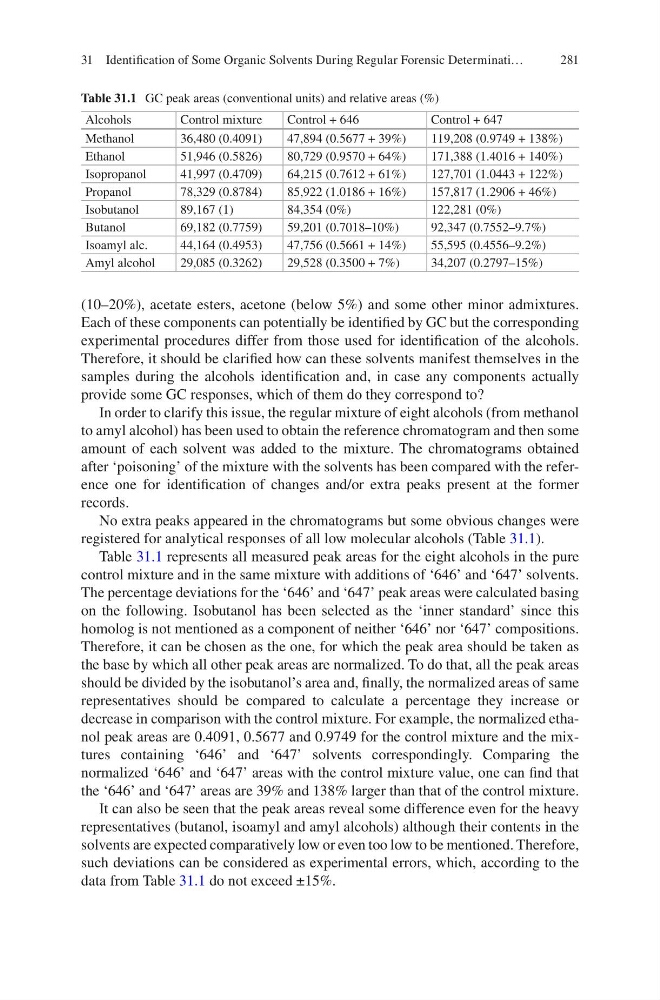
registered for analytical responses of all low molecular alcohols (Table 31.1).
Table 31.1 represents all measured peak areas for the eight alcohols in the pure
control mixture and in the same mixture with additions of ‘646’ and ‘647’ solvents.
The percentage deviations for the ‘646’ and ‘647’ peak areas were calculated basing
on the following. Isobutanol has been selected as the ‘inner standard’ since this
homolog is not mentioned as a component of neither ‘646’ nor ‘647’ compositions.
Therefore, it can be chosen as the one, for which the peak area should be taken as
the base by which all other peak areas are normalized. To do that, all the peak areas
should be divided by the isobutanol’s area and, finally, the normalized areas of same
representatives should be compared to calculate a percentage they increase or
decrease in comparison with the control mixture. For example, the normalized ethanol peak areas are 0.4091, 0.5677 and 0.9749 for the control mixture and the mixtures containing ‘646’ and ‘647’ solvents correspondingly. Comparing the
normalized ‘646’ and ‘647’ areas with the control mixture value, one can find that
the ‘646’ and ‘647’ areas are 39% and 138% larger than that of the control mixture.
It can also be seen that the peak areas reveal some difference even for the heavy
representatives (butanol, isoamyl and amyl alcohols) although their contents in the
solvents are expected comparatively low or even too low to be mentioned. Therefore,
such deviations can be considered as experimental errors, which, according to the
data from Table 31.1 do not exceed ±15%.
Table 31.1 GC peak areas (conventional units) and relative areas (%)
Alcohols
Control mixture
Control + 646
Control + 647
Methanol
36,480 (0.4091)
47,894 (0.5677 + 39%)
119,208 (0.9749 + 138%)
Ethanol
51,946 (0.5826)
80,729 (0.9570 + 64%)
171,388 (1.4016 + 140%)
Isopropanol
41,997 (0.4709)
64,215 (0.7612 + 61%)
127,701 (1.0443 + 122%)
Propanol
78,329 (0.8784)
85,922 (1.0186 + 16%)
157,817 (1.2906 + 46%)
Isobutanol
89,167 (1)
84,354 (0%)
122,281 (0%)
Butanol
69,182 (0.7759)
59,201 (0.7018–10%)
92,347 (0.7552–9.7%)
Isoamyl alc.
44,164 (0.4953)
47,756 (0.5661 + 14%)
55,595 (0.4556–9.2%)
Amyl alcohol
29,085 (0.3262)
29,528 (0.3500 + 7%)
34,207 (0.2797–15%)
31 Identification of Some Organic Solvents During Regular Forensic Determinati…
(10–20%), acetate esters, acetone (below 5%) and some other minor admixtures.
Each of these components can potentially be identified by GC but the corresponding
experimental procedures differ from those used for identification of the alcohols.
Therefore, it should be clarified how can these solvents manifest themselves in the
samples during the alcohols identification and, in case any components actually
provide some GC responses, which of them do they correspond to?
In order to clarify this issue, the regular mixture of eight alcohols (from methanol
to amyl alcohol) has been used to obtain the reference chromatogram and then some
amount of each solvent was added to the mixture. The chromatograms obtained
after ‘poisoning’ of the mixture with the solvents has been compared with the reference one for identification of changes and/or extra peaks present at the former
records.
No extra peaks appeared in the chromatograms but some obvious changes were
registered for analytical responses of all low molecular alcohols (Table 31.1).
Table 31.1 represents all measured peak areas for the eight alcohols in the pure
control mixture and in the same mixture with additions of ‘646’ and ‘647’ solvents.
The percentage deviations for the ‘646’ and ‘647’ peak areas were calculated basing
on the following. Isobutanol has been selected as the ‘inner standard’ since this
homolog is not mentioned as a component of neither ‘646’ nor ‘647’ compositions.
Therefore, it can be chosen as the one, for which the peak area should be taken as
the base by which all other peak areas are normalized. To do that, all the peak areas
should be divided by the isobutanol’s area and, finally, the normalized areas of same
representatives should be compared to calculate a percentage they increase or
decrease in comparison with the control mixture. For example, the normalized ethanol peak areas are 0.4091, 0.5677 and 0.9749 for the control mixture and the mixtures containing ‘646’ and ‘647’ solvents correspondingly. Comparing the
normalized ‘646’ and ‘647’ areas with the control mixture value, one can find that
the ‘646’ and ‘647’ areas are 39% and 138% larger than that of the control mixture.
It can also be seen that the peak areas reveal some difference even for the heavy
representatives (butanol, isoamyl and amyl alcohols) although their contents in the
solvents are expected comparatively low or even too low to be mentioned. Therefore,
such deviations can be considered as experimental errors, which, according to the
data from Table 31.1 do not exceed ±15%.
Table 31.1 GC peak areas (conventional units) and relative areas (%)
Alcohols
Control mixture
Control + 646
Control + 647
Methanol
36,480 (0.4091)
47,894 (0.5677 + 39%)
119,208 (0.9749 + 138%)
Ethanol
51,946 (0.5826)
80,729 (0.9570 + 64%)
171,388 (1.4016 + 140%)
Isopropanol
41,997 (0.4709)
64,215 (0.7612 + 61%)
127,701 (1.0443 + 122%)
Propanol
78,329 (0.8784)
85,922 (1.0186 + 16%)
157,817 (1.2906 + 46%)
Isobutanol
89,167 (1)
84,354 (0%)
122,281 (0%)
Butanol
69,182 (0.7759)
59,201 (0.7018–10%)
92,347 (0.7552–9.7%)
Isoamyl alc.
44,164 (0.4953)
47,756 (0.5661 + 14%)
55,595 (0.4556–9.2%)
Amyl alcohol
29,085 (0.3262)
29,528 (0.3500 + 7%)
34,207 (0.2797–15%)
31 Identification of Some Organic Solvents During Regular Forensic Determinati…